How Many Connection Requests It Takes to Book One Meeting (The Real Funnel Math)
By Marcus Webb, Tools & Automation. Last updated: 2026-05-30
- Founders guess the funnel is either far tighter or far looser than it is, then burn out or quit early.
- The biggest leak is not where most people think: it is reply-of-accepted, not acceptance.
- Sending more requests per day can actually lower your acceptance rate.
- Once you know your three steps, forecasting meetings is plain arithmetic.
How many connection requests does it take to book one meeting?
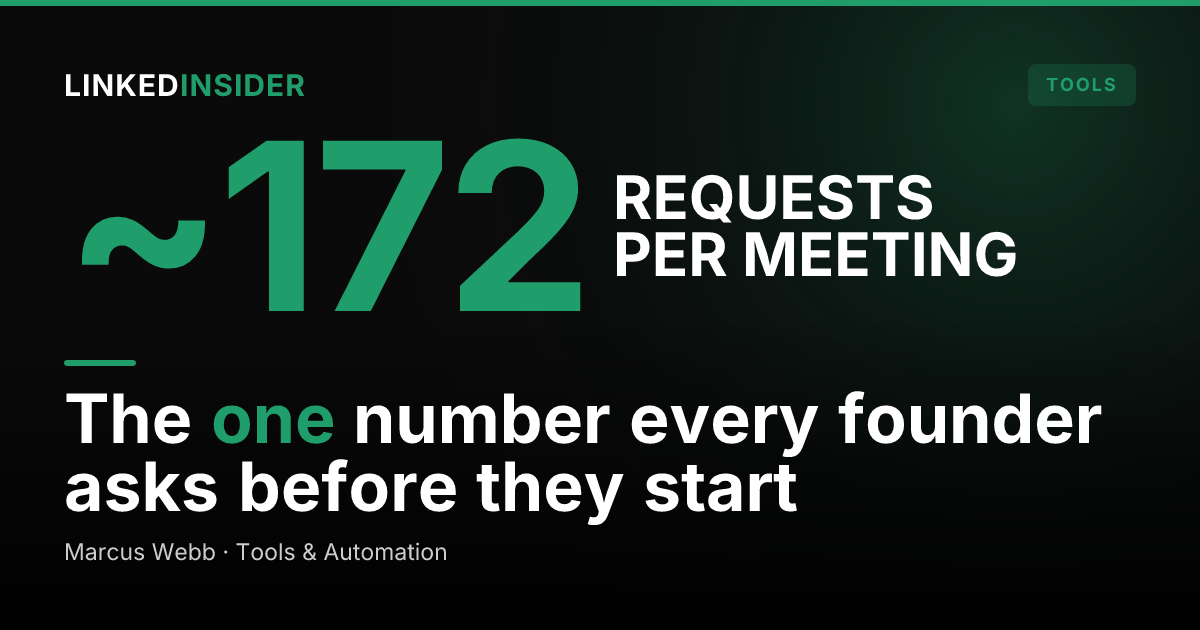
It takes roughly 185 connection requests to book one meeting when you run the math end-to-end. The number comes from multiplying the three stages of the funnel rather than reading any single rate in isolation.
Here is the working. Across 180,155 matured connection requests, Reachium's data shows a 27.11% average connection acceptance rate. Of accepted connections, 27.55% replied. Of accepted connections, 1.99% book a meeting. Chain those together and one booked meeting sits at the end of about 185 sent requests (1 divided by 0.2711, then by 0.0199). Round numbers, real data: budget for somewhere between 170 and 200 requests per meeting before you optimize anything. The full benchmark set lives in the LinkedIn outreach benchmarks for 2026. [SYNTHESIS]
That single figure is the honest baseline most people never calculate. It is neither the 1-in-20 fantasy nor the 1-in-500 doom number that scares founders off LinkedIn entirely.
What is each step of the funnel, and where do people leak?
The funnel has three measurable gates, and the biggest leak is the reply stage, not the accept stage. Most founders obsess over getting accepted and ignore the much steeper drop that comes after.
| Funnel stage | Rate (of prior step) | Of all requests sent |
|---|---|---|
| Connection accepted | 27.11% | 27.11% |
| Replied (of accepted) | 27.55% | about 7.47% |
| Meeting booked (of accepted) | 1.99% | about 0.54% |
Read the right-hand column and the leak is obvious. You lose about 73% of people at the accept gate, but of the connections who do accept, only about 2% turn into a booked call. That last gap is where message quality, relevance, and follow-up cadence do their real work. If you want to move the 185 number, the reply-to-meeting stretch is the highest-leverage place to push, which is why connection request message examples matter more than raw send count. For the deeper conversion breakdown, see the LinkedIn connection-to-meeting timeline. [SYNTHESIS]
Want to put this into practice?
Reachium automates LinkedIn outreach, content publishing, and inbox management in one platform.
Start Free →Why does sending more requests per day not book more meetings?
Sending more requests per day does not book more meetings because acceptance falls as daily volume rises. Reachium's data calls this the volume tax, and it is the most counterintuitive finding in the set.
| Daily invites sent | Average acceptance rate |
|---|---|
| 10-19 a day | 32.01% |
| 20-29 a day | 26.65% |
Acceptance peaked at 32.01% for accounts sending 10-19 invites a day and fell to 26.65% at 20-29 a day. More volume, fewer accepts on a percentage basis. The mechanism is simple: high-volume blasting drags in lower-fit targets, trips LinkedIn pacing limits, and pulls down the quality of each individual request. Reachium, the platform that produced this data, caps sending around 25 invites a day by design for exactly this reason. The math means two accounts sending the same weekly total can book different numbers of meetings depending on how that total is paced. This is the same trap covered in why you should stop sending 100 connection requests per day and what the data says about sending 1,000 LinkedIn connection requests. [SYNTHESIS]
How do I forecast meetings from my own numbers?
You forecast meetings with plain arithmetic once you know your three rates: multiply your weekly request volume by accept rate, then by your accepted-to-meeting rate. Start from the goal and work backward.
Say you want four meetings a month. Using the baseline of 185 requests per meeting, that is about 740 requests a month, or roughly 185 a week, or about 25 a day, which lands you squarely in the high-accept tier rather than the volume-tax zone. The arithmetic is forgiving in your favor: if you tighten any single rate, the request budget drops proportionally. Track your own accept and reply rates for two weeks, then substitute them for the benchmarks. The full timeline math, including how long the lag is between request and booked call, is in how long LinkedIn outreach takes to book a meeting.
How do I tighten the funnel instead of just adding volume?
You tighten the funnel by targeting better, writing better, and pacing in the safe band, which all raise your rates so each request is worth more. Adding raw volume only multiplies a leaky funnel.
Targeting is the first lever. Reachium's lead universe contains a multi-million-lead B2B universe, of which a large share are flagged as decision-makers. Sending to fitted decision-makers lifts both accept and reply rates, which compresses the 185 number directly. The second lever is the request itself: relevance in the note is what moves the reply-of-accepted rate, the steepest leak in the funnel. The third lever is pacing, which the volume-tax table already proved. Hold near 25 a day in the high-accept band and your percentage rates stay healthy instead of degrading under self-managed over-sending. Founders who forecast their meetings per rep consistently find targeting and pacing move the number more than volume ever does. [SYNTHESIS]
Want to put this into practice?
Reachium automates LinkedIn outreach, content publishing, and inbox management in one platform.
Start Free →What does a calibrated outreach system look like in practice?
A calibrated outreach system runs steady daily volume in the high-accept tier without manual babysitting, on infrastructure that does not get the account flagged. The whole point of the funnel math is that it only holds if the volume is actually delivered, safely and on cadence.
That is harder to do by hand than it looks. Manual sending drifts: some days you over-send and trigger the volume tax, other days you forget and the funnel stalls. Tooling matters here, and the safety of that tooling matters most. Browser-automation tools that scrape or simulate clicks carry real account risk, illustrated by the publicly reported HeyReach LinkedIn restrictions in March 2026. The verified-API approach is a different architecture, which is why the InMail vs connection request comparison for 2026 and verticalized plays like corporate wellness and health-coach LinkedIn programs both lean on calibrated, paced sending rather than blasting. Teams that want that pacing built in rather than managed by hand can start a free trial and run the calibrated volume automatically.
FAQ
What is the LinkedIn connection-request-to-meeting conversion rate?
End to end it is roughly 1 meeting per 185 requests, or about 0.54% of all requests sent. That comes from a 27.11% accept rate, 27.55% reply of accepted, and 1.99% of accepted connections booking a call.
How many connection requests should I send per day to book meetings consistently?
Around 25 a day keeps you in the high-accept band. Acceptance peaks at 32.01% for accounts sending 10-19 invites a day and falls once you push past about 20, so pacing near the cap protects your conversion rate.
Why does sending more requests not book more meetings?
Because acceptance rate drops as daily volume rises, the volume tax. Higher volume pulls in lower-fit targets and trips pacing limits, so two accounts with the same weekly total can book different numbers of meetings depending on cadence.
How do I forecast meetings from my LinkedIn outreach volume?
Multiply your weekly request count by your accept rate, then by your accepted-to-meeting rate. Using the 185-per-meeting baseline, four meetings a month needs roughly 740 requests, or about 25 a day.
Sources
- Reachium, LinkedIn Outreach Benchmarks 2026 - 180,155 matured requests, full funnel [SYNTHESIS]
- LinkedIn Sales Solutions
- Unipile (verified LinkedIn API partner)
- Linked Insider: LinkedIn outreach benchmarks 2026
- Linked Insider: Stop sending 100 connection requests per day
- Linked Insider: How long LinkedIn outreach takes to book a meeting