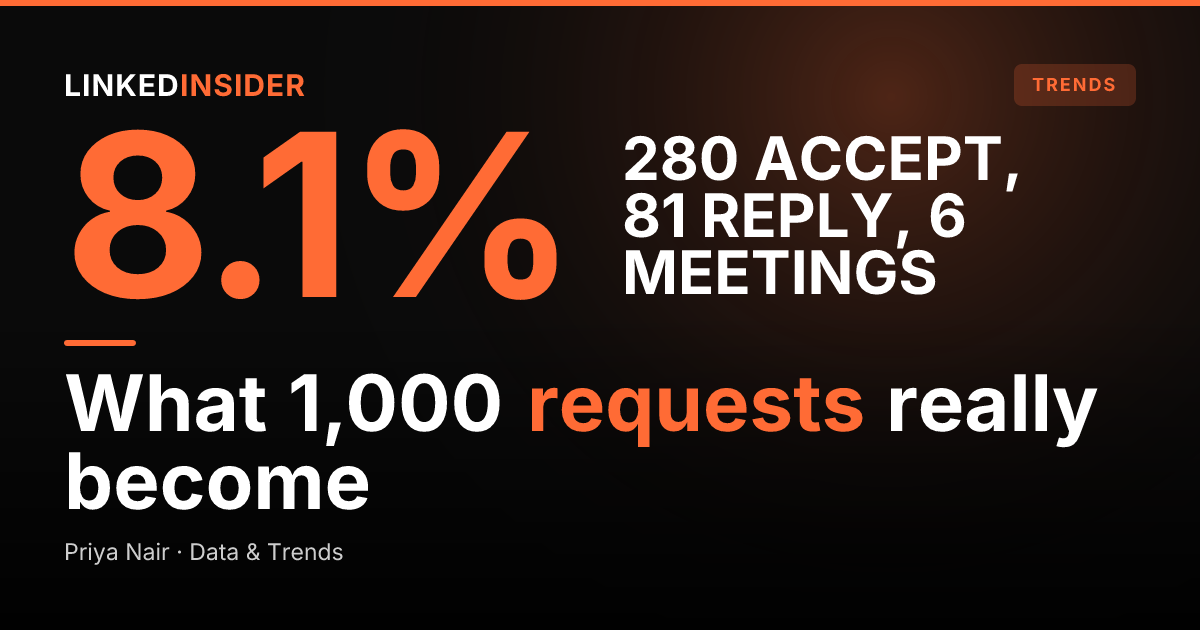
What Happens to 1,000 LinkedIn Connection Requests?
By Priya Nair, Data & Trends. Last updated: 2026-05-28
Every SDR eventually hits the same question. The monthly campaign report lands, the acceptance number sits at some percent, the reply number sits at some other percent, and nobody can say whether that is good, average, or broken. The fix is a complete funnel with the same denominators all the way through. That is what this post is.
The data behind every stage rate below comes from one source: 441,965 outreach sequences and 180,155 connection requests run on the verified API, between January 2025 and August 2026. No vendor blending, no idealized diagram. The point is that the arithmetic ties out, so a rep can plug in a real send number and see what it should produce.
What happens to 1,000 LinkedIn connection requests?
Across 180,155 LinkedIn connection requests, about 27.11% were accepted, 27.55% of accepted connections replied (which is 7.47% of everything sent), and 1.99% of accepted connections turned into a booked meeting. [SYNTHESIS] Per 1,000 requests, the funnel looks like this:
| Funnel stage | Rate | Per 1,000 requests |
|---|---|---|
| Connection requests sent | 100% | 1,000 |
| Accepted | 27.11% | ~271 |
| Replied (27.55% of accepted) | 7.47% of sent | ~75 |
| Meetings booked (1.99% of accepted) | ~0.54% of sent | ~5 |
A thousand cold requests is, realistically, about five meetings. That is not a failure mode. That is the platform-average baseline for cold B2B outreach, and knowing it lets a rep work backwards from a meeting quota to a send target instead of guessing. A rep who needs 10 booked meetings a month from cold outreach is implicitly committing to roughly 1,850 connection requests across that window, at average rates. That is the math.
The same dataset anchors the broader study at LinkedIn outreach benchmarks 2026, which puts the per-stage Reachium numbers next to Expandi's 13.2M-request public benchmark. The two datasets agree closely on the acceptance stage and diverge slightly on the downstream stages, which is consistent with the industry trend that reply rates are tightening faster than acceptance rates.
How many connection requests get accepted?
Stage one is acceptance, and it is the single biggest filter in the funnel. Across 180,155 requests, 27.11% were accepted. [SYNTHESIS] Per 1,000 requests, that is roughly 271 acceptances.
The platform-wide acceptance band for cold B2B outreach sits at 26 to 30%, according to Expandi's public benchmark of 13.2 million connection requests. Reachium's 27.11% sits squarely inside it. So a rep landing anywhere in the 26 to 30% band is at platform average. Below 20% is the red zone, where targeting or profile is dragging the funnel and the LinkedIn safety system may also start throttling sending capacity. If almost none of your requests get accepted at all, the diagnostic walkthrough in why no one accepts your LinkedIn connection requests ranks the causes in fix order. The four-band benchmark with diagnostic levers is broken out in What is a good LinkedIn connection acceptance rate?. [SYNTHESIS]
What moves the acceptance stage, in order of leverage: ICP targeting tightness, sender profile strength, and warm-touch sequencing before the request. What does not move it materially: sender seniority (Expandi's data shows only a 2.1-point gap between C-level and manager-level senders across 6.5 million requests) and the choice between a templated note and a blank request: Reachium's connection-note study found the acceptance effect of notes is inconclusive (in the paired within-account test, two of three accounts actually accepted better with a note), while the reply effect is robust, 47.80% versus 25.54% of accepted. The note question is covered separately in Should you add a note to a LinkedIn connection request?. [SYNTHESIS]
One counterintuitive lever: volume. Pushing daily send volume higher tends to lower acceptance, not raise it. Reachium's data shows acceptance peaks at 32.01% for accounts sending 10 to 19 invites a day, then falls to 26.65% at 20 to 29 a day. [SYNTHESIS] More volume, fewer accepts per send. The full mechanic is covered in Stop sending 100 connection requests per day.
Want to put this into practice?
Reachium automates LinkedIn outreach, content publishing, and inbox management in one platform.
Start Free →How many accepted connections actually reply?
Stage two is the reply rate, and this is where reps and managers most often talk past each other.
Of 48,836 accepted connections in the same dataset, 27.55% replied. [SYNTHESIS] On the per-1,000 funnel, that produces roughly 75 replies, which is 7.47% of everything sent. Both denominators are real, and both are useful, but they answer different questions:
- Reply rate of accepted (27.55%): what proportion of new connections you actually held a conversation with. This is the quality-of-conversation metric.
- Reply rate of all sent (7.47%): what proportion of total outreach effort produced a reply. This is the funnel-throughput metric.
A rep whose tool reports 27.55% reply rate and a rep whose tool reports 7.47% reply rate, the two denominators in Reachium's benchmark data cited above, may be doing exactly the same work. The number changes; the funnel does not. Before benchmarking against anyone else's reply-rate stat, a rep should confirm which denominator that stat is using. [SYNTHESIS]
The reply stage is where message quality, follow-up cadence, and personalization actually move the number. The acceptance stage is targeting and profile; the reply stage is what you say once they connect. Cold acceptance is closer to a yes-to-keep-options-open than a yes-to-a-conversation, so a reply requires earning a second beat after the request lands. Reps whose reply rate of accepted sits well under 25% are usually leading with a pitch, leaning on a single follow-up, or both. Diagnostic patterns are covered in Why your LinkedIn outreach is not working.
How many connection requests does it take to book one meeting?
Stage three is the meeting rate, and the per-1,000 funnel resolves to roughly five. Across 48,836 accepted connections, 1.99% turned into a booked meeting. [SYNTHESIS] Per 1,000 sent requests at platform-average rates, that is about five meetings.
That math runs in reverse cleanly. To book 10 meetings a month from cold outreach at baseline rates, a rep needs to land roughly 500 accepted connections, which means sending roughly 1,850 connection requests across the same window. At the safe daily cap of around 25 invites a day, that is at or above what a single account can sustain by itself. A rep targeting more than 10 meetings a month from pure cold outreach is implicitly running multiple accounts, accepting a lower per-account acceptance rate, or both. This is where honest funnel arithmetic ends the "just send more" reflex.
The lever at this stage is not volume. It is conversation quality and the offer. A rep converting accepted connections to meetings at 4% instead of 2% doubles meeting output without sending a single extra request. A rep who lifts that to 5% triples it. The arithmetic favors stage-rate improvement at every point in the funnel because the gains compound: better acceptance means more inputs to the reply stage, better reply means more inputs to the meeting stage, and so on.
Where does the LinkedIn connection acceptance funnel leak the most?
By raw count, the acceptance stage is the largest leak. Out of 1,000 sent, 729 never accept. By proportion, the reply stage is comparable: of 271 who accept, about 196 never reply. The meeting stage drops about 266 from the 271 accepted, but because the upstream stages already filtered hard, the absolute count is small.
Diagnostic order for a rep auditing their own funnel:
- Is acceptance below 26%? Targeting and profile, not the message. Pull the recipient list and check how many actually match the ICP on title, seniority, and company size. Check the profile for photo clarity, an active headline, posts within the last 30 days, and a Featured section with a clear CTA.
- Is acceptance fine but reply rate of accepted is under 20%? Post-connection messaging is the leak. Look at the first message. If it opens with a pitch instead of context, that is the issue. If there is only one follow-up, sequence it to two or three with real value beats between them.
- Is reply rate strong but meeting rate of accepted is under 1%? The offer or CTA is the leak. The reply is happening; the conversion to a calendar invite is not. Usually a CTA-clarity or value-of-the-meeting problem.
The strategic point: chasing more sends fixes none of these leaks and adds account risk through the volume tax. Improving stage rates compounds. Starting from Reachium's benchmark averages, a rep who lifts acceptance from 27.11 to 35% and reply-of-accepted from 27.55 to 35% gets roughly 64% more meetings from the same send volume. That is the actual leverage point, not raw output. [SYNTHESIS]
Want to put this into practice?
Reachium automates LinkedIn outreach, content publishing, and inbox management in one platform.
Start Free →How do you improve each stage of the LinkedIn funnel?
A stage-by-stage playbook, kept short because each stage is its own deeper post.
Acceptance stage. Tighten the ICP filters until 90%+ of the list is a clear match. Refresh the profile (photo, headline, About, last-30-days posts) before scaling sends. Add a two-step warm sequence: view the profile and engage with one of their recent posts, wait two days, then send the request. These three combined typically push acceptance from the 26 to 30% average band, the range Expandi's benchmark established earlier, into the 35 to 40% good band on the same list. [SYNTHESIS]
Reply stage. Drop the pitch from the first message. Lead with the reason the request happened (what you saw, what they posted, what changed at their company), then ask one question that takes them under 30 seconds to answer. Sequence two to three follow-ups two to four days apart, each adding a beat of value rather than re-pitching. Reps doing this often lift reply-of-accepted from the 27.55% average in Reachium's benchmark data into the 35 to 40% range. [SYNTHESIS]
Meeting stage. Make the CTA frictionless: a booking link, a 15-minute time, a clear single reason to meet. Skip the "are you open to a chat" wording, which tests poorly. Offer a specific value the meeting delivers (a teardown, a benchmark, an audit), not a vague "exchange ideas."
The other lever, underrated by most outbound teams: warm inbound. Replies and acceptance are structurally higher when the prospect engaged with content first. Lead-magnet posts (the comment-keyword to auto-DM mechanic) tend to draw far more impressions and engagement than regular feed posts, and a commenter who triggers an auto-DM is structurally a warmer input than a cold connection request, so the conversation starts much further down the funnel.
FAQ
How many LinkedIn connection requests does it take to book one meeting?
At platform-average rates from 180,155 measured requests, roughly 185 sent requests produce one booked meeting (about five meetings per 1,000 sent). [SYNTHESIS] A rep who needs 10 meetings a month from cold outreach is implicitly committing to roughly 1,850 sends across that window at baseline rates.
What is a good reply rate on LinkedIn outreach?
It depends on the denominator. Of accepted connections, 25 to 30% is platform average and 35%+ is good. Of all requests sent, 7 to 10% is platform average and 12%+ is good. The two numbers describe the same campaign and differ by roughly 3.7x because the acceptance stage filters out most sends before the reply stage even begins.
Is reply rate measured against accepted connections or total requests sent?
Both, depending on the tool, which is why benchmarks are often miscompared. Reply rate of accepted is the quality-of-conversation metric (27.55% in Reachium's data). Reply rate of all sent is the funnel-throughput metric (7.47% in the same dataset). Confirm which one the report is showing before comparing it to anyone else's number.
Why are my accepted connections not replying?
The two most common causes are a first message that opens with a pitch instead of context, and a sequence with only one follow-up. Reply-of-accepted under 20% usually traces to one of those. The fix is leading with the specific reason the request happened, asking a 30-second question, and sequencing two to three follow-up beats spaced two to four days apart.
How can I get more meetings without sending more connection requests?
Improve stage rates instead of input volume. Lifting acceptance from 27.11 to 35% and reply-of-accepted from 27.55 to 35% yields roughly 64% more meetings from the same sends. Warm inbound (a comment-to-DM lead magnet) also adds meetings without adding any outbound volume, by starting conversations with prospects who already engaged with content.
Sources
- Linked Insider: LinkedIn outreach benchmarks 2026
- Linked Insider: LinkedIn acceptance rate benchmark
- Linked Insider: Stop sending 100 connection requests per day
- Linked Insider: LinkedIn connection request note
- Linked Insider: LinkedIn outreach not working (fixes)
- Reachium
- Expandi: LinkedIn Outreach Benchmarks 2026 (13.2M requests)
- Botdog: LinkedIn acceptance rates study (16,492 invitations)
- Cleverly: LinkedIn Benchmarks 2026