How Many Meetings Should One Rep Book From LinkedIn Per Month?
By Elena Marsh, Strategy & Algorithm. Last updated: 2026-05-23
Your reps sent 400 connection requests last month. How many meetings should that have produced?
Most sales leaders can't answer that question with confidence. They have activity metrics: requests sent, messages fired, connections accepted. They don't have a clear line from those inputs to meetings booked. This piece gives you the funnel math.
What is a realistic monthly LinkedIn meetings-per-rep benchmark for B2B?
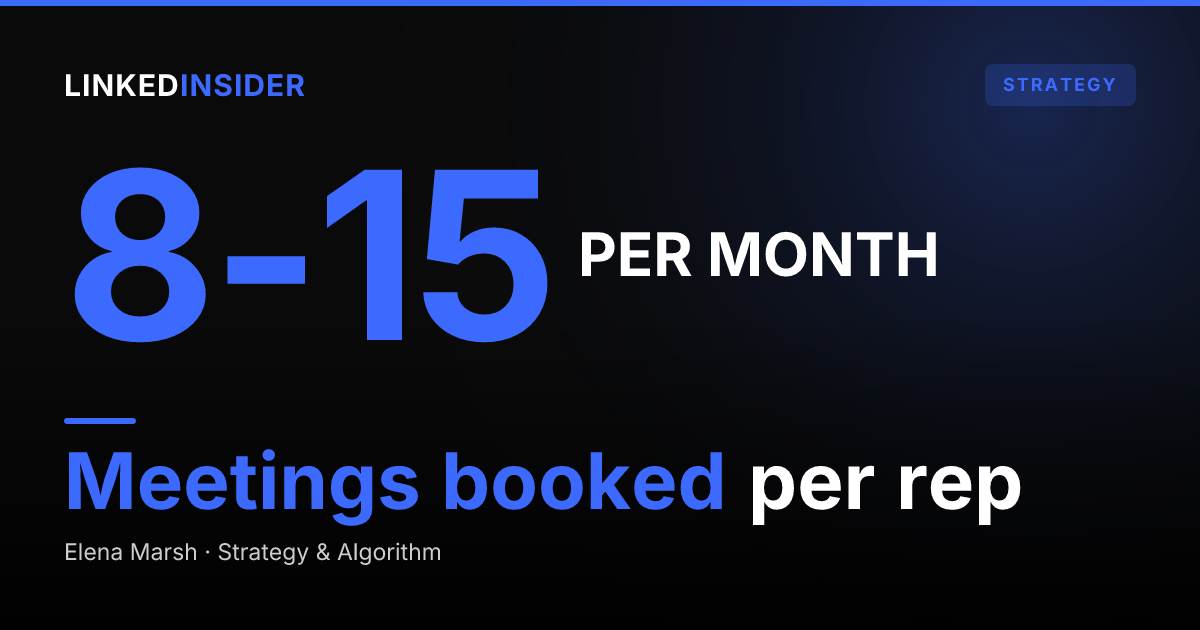
The usable range is not a single number. The Bridge Group's SDR Metrics & Comp Report, the most widely cited SDR benchmark covering hundreds of B2B companies, puts the median qualified meeting quota for outbound SDRs in the range of 8-10 per month. Top-quartile teams reach 12-15. This range is consistent across multiple independent practitioner datasets and sales-ops benchmarks.
| Performance Band | Qualified Meetings/Month (LinkedIn Outbound) |
|---|---|
| Bottom quartile | 3-5 |
| Median | 8-10 |
| Good | 10-12 |
| Top quartile | 12-15 |
| Inbound-assisted | 20-25 |
Three confounders can shift any team's position on this table significantly:
Inbound-assisted reps skew high. Teams where marketing generates warm intent signals alongside cold outreach routinely report 20-25 meetings per month. That number is not a cold-outbound benchmark. Using it as one sets an unreachable standard for a pure-outbound SDR.
ICP tightness matters more than raw volume. High acceptance rates from the wrong audience inflate the vanity metric without producing qualified conversations. A VP who sees "15 meetings per month" without knowing the positive-reply rate and meeting-booked rate by stage doesn't know whether they're a top-quartile team or a high-volume team booking the wrong people.
Activity quality drives conversion, not activity quantity. Sending 1,000 generic connection requests produces fewer meetings than sending 400 targeted, personalized ones. The benchmark table reflects teams running intentional sequences, not spray-and-pray volume.
State the benchmark clearly: 8-10 per account per month is the target for a median outbound SDR. The rest of this piece explains why, and where most teams fall short of it.
What does the LinkedIn funnel from connection request to meeting actually look like?
The five-stage funnel explains why the benchmark number is what it is. Walk each stage with published conversion ranges and the math closes cleanly.
Stage 1: Connection requests sent. LinkedIn's standard limit is approximately 100 invitations per week for most accounts, with high-trust accounts (SSI score above 65, acceptance rate above 40%) reaching up to 200 per week. Consistently reported across 2026 guides from Konnector.ai, Evaboot, and LinkedSDR, though LinkedIn publishes no official figure. A standard rep sending 100 per week generates roughly 400 requests per month. [SYNTHESIS]
Stage 2: Acceptance rate. Expandi's LinkedIn Outreach Benchmarks 2026 report, analyzing 13.2 million connection requests sent through 13,302 active LinkedIn accounts between May 2025 and April 2026, puts the platform-wide acceptance rate at 28.5%. That converts 400 monthly requests into approximately 114 accepted connections. [SYNTHESIS]
Stage 3: Post-connection reply rate. The same Expandi dataset puts the post-connection message reply rate at 10.4% across the platform. Applied to 114 accepted connections, that is roughly 12 replies per month at the median. Top-quartile teams with conditional sequences, AI personalization, and precise ICP targeting reach 25-30%+ on this stage. Teams using generic templates land at 3-5%. [SYNTHESIS]
One useful data point from Belkins' 2025 LinkedIn outreach study: campaigns combining a direct message with a profile visit achieved an 11.87% reply rate, the highest among two-action sequences. Multi-touch sequences with conditional branching consistently outperform single-step messages. [SYNTHESIS]
Stage 4: Positive-reply rate. Not all replies are positive. A reply rate of 10.4% includes objections, "not interested," and "remove me." SalesBread's campaign data reports that 48.14% of replies across their personalized LinkedIn campaigns are positive signals: meeting requests or qualified sales inquiries. At a 10.4% gross reply rate, roughly 4-6 of those 12 replies per month are real conversations. [SYNTHESIS]
Stage 5: Reply to booked meeting. SalesBread reports approximately a 25% meeting rate on positive replies from their campaigns. Applied to 5 positive replies, that produces roughly 1-2 meetings per week, or 4-8 per month at the low end. [SYNTHESIS]
The math closes. Here is the illustrative funnel using published median benchmarks. Actual results vary by ICP, copy, and sequence quality:
| Stage | Calculation | Monthly Output |
|---|---|---|
| Requests sent (100/week limit) | 100 x 4 weeks | 400 |
| Accepted (28.5%) | 400 x 0.285 | 114 |
| Replies (10.4%) | 114 x 0.104 | ~12 |
| Positive replies (48% of replies) | 12 x 0.48 | ~6 |
| Meetings booked (25% meeting rate) | 6 x 0.25 | ~1.5 |
Table: Illustrative funnel math using published median benchmarks. Not a cited stat. Actual results vary by ICP, copy, and sequence quality.
At that median conversion stack, a single account at the 100/week limit produces roughly 4-8 meetings per month. Hitting the 8-10 median benchmark requires either above-median conversion rates (better ICP, better copy, conditional sequences) or more accepted connections converting further down-funnel. Hitting the top-quartile 12-15 meetings requires both. The math doesn't lie about the ceiling.
Want to put this into practice?
Reachium automates LinkedIn outreach, content publishing, and inbox management in one platform.
Start Free →Why do reps get replies but not meetings?
Most pipeline leak does not happen at the top of the funnel. Teams rarely suffer from too few connection requests. They leak meetings at three predictable stages.
Leak 1: Acceptance without follow-through. A connected prospect who receives no sequence trigger within 24-48 hours is a wasted acceptance. If the sequence does not fire automatically on accept, that connection sits dormant. High acceptance rates paired with low reply rates almost always trace to this gap. The automation layer, not the rep's typing speed, is what determines whether every accept gets followed up consistently.
Leak 2: Reply triage lag. A positive reply that sits unread for 48 hours goes cold. Prospects who signal interest and hear nothing assume the company is disorganized or moved on. In a team with multiple reps managing separate accounts, this problem compounds: replies are distributed across disconnected inboxes, and no one has a single-pane view of which conversations need immediate attention. A unified inbox is not a nice-to-have at this stage. It is the operational fix that stops positive signals from dying on the vine.
Leak 3: Generic follow-up after the first positive signal. The most common sequence design error: a prospect replies with interest, and the system fires the next pre-scheduled generic message rather than branching to a booking-focused sequence. Conditional sequencing, where the next step depends on whether the prospect connected, viewed, replied, or specifically replied positively, is what separates median teams from top-quartile ones. A linear drip that ignores reply signals will consistently underperform on the reply-to-meeting conversion stage.
Leak 4: Wrong ICP acceptance. High acceptance from the wrong people flatters the vanity metric without producing qualified conversations. If an SDR's audience is too broad, acceptance rates look healthy while positive-reply rates and meeting-booked rates remain flat. A sales leader needs to track positive-reply rate and booked-meeting rate as the actual output metrics, not total connection requests or even gross reply rate. For a full stage-by-stage diagnostic, see Linked Insider's LinkedIn response rate benchmarks.
For the complementary list of mistakes that kill reply rate before the funnel even gets to triage, linkedin-outreach-mistakes-kill-reply-rate is the right follow-on read.
How many connection requests per day is safe, and what does that do to the ceiling?
LinkedIn's current standard limit is approximately 100 invitations per week for most accounts. High-trust accounts with strong SSI scores and above-40% acceptance rates can reach up to 200 per week. LinkedIn does not publish an official figure; the 100/week baseline is reported consistently across 2026 guides from Konnector.ai, Evaboot, and LinkedSDR. [SYNTHESIS]
At 100 per week, a single account sends roughly 400-500 requests per month. Using the Expandi and SalesBread conversion rates above, the ceiling math: [SYNTHESIS]
- 400 requests x 28.5% acceptance = 114 accepted connections
- 114 x 10.4% reply rate = ~12 replies
- 12 x 48% positive = ~6 positive replies
- 6 x 25% meeting rate = ~1.5 meetings per week, or 4-8 per month
To hit top-quartile (12-15 meetings per month) from one account requires above-median conversion at every stage: tighter ICP, better copy, conditional sequences, and consistent follow-through on accepts. That is achievable with the right infrastructure, but it is the ceiling for a single account regardless.
The 80-100 per account per day recommendation you see in most guides translates to the same weekly math. The per-day framing matters for warmup and trust-score management; the per-week limit is what actually caps meeting output.
For the full mechanics on why pushing past these limits triggers restriction and how LinkedIn's trust score system works, stop-sending-100-connection-requests-per-day covers the platform mechanics in detail.
How does adding accounts change the meetings-per-rep ceiling?
This is the structural lever most single-account analyses miss.
If a single account is mathematically constrained to 4-8 meetings per month at median conversion using the benchmarks above, a second account on the same rep adds another 4-8 meetings from a separate audience pool without adding a headcount. Three accounts per rep can reach 3x the pipeline ceiling at the per-account conversion rate. [SYNTHESIS]
The risk with browser-automation tools running multiple accounts: ban probability rises with each additional account because the traffic signature looks like one person operating multiple sessions. LinkedIn's detection systems flag that pattern. The verified-API approach solves this architecturally: traffic originates through LinkedIn's own verified Unipile API, so the signature is identical to native LinkedIn regardless of how many accounts run simultaneously.
Reachium calibrates each account to roughly 25 invites per day, which works out to about 800 connection requests per account per month of capacity (a design calibration, not a measured average). Reachium's published benchmark study shows 1.99% of 48,836 accepted connections converted to a booked meeting, consistent with the median funnel math above, and a useful anchor for any sales leader building their own projection: at the published 27.11% acceptance rate, that is roughly one booked meeting per 185 requests, or about 4 meetings per account per month at full capacity. See LinkedIn outreach benchmarks 2026 for the full funnel dataset. At those figures, a sales leader running two accounts per rep is looking at roughly double that ceiling per rep, without adding headcount. [SYNTHESIS]
The framing that matters for a VP of Sales: multi-account orchestration is not about pushing more messages. It is about running distinct, documented playbooks, an Outreach Campaign to cold ICP targets, a Lead Magnet campaign to warm inbound content engagers, and eventually a Retargeting campaign to re-engage warm audiences, each with its own account, so the team's pipeline output scales with infrastructure rather than headcount. For teams consolidating onto a single multi-account platform from a fragmented stack, the operational sequence is in the outreach stack migration playbook, which covers the 30-day parallel run and the one-sender-at-a-time cutover that protects the funnel during the move.
For a concrete use-case of what this looks like in practice for a B2B team, how-one-b2b-team-booked-47-meetings-linkedin shows the multi-account playbook end to end.
Want to put this into practice?
Reachium automates LinkedIn outreach, content publishing, and inbox management in one platform.
Start Free →What does the full funnel ceiling look like across account configurations?
The ceiling scales almost linearly with total weekly volume, not account count on its own: a single rep on the standard 100-per-week limit tops out around 4 to 8 meetings a month, while three accounts at the same limit push the same rep to a 12 to 22 meeting ceiling. A single high-trust account at a 200-per-week limit produces roughly what two standard accounts produce, since both configurations send the same total volume.
| Configuration | Monthly Requests | Expected Acceptances | Expected Replies | Expected Meetings |
|---|---|---|---|---|
| 1 account (100/wk limit) | 400 | 114 | 12 | 4-8 |
| 1 account (200/wk high-trust) | 800 | 228 | 24 | 8-15 |
| 2 accounts (100/wk each) | 800 | 228 | 24 | 8-15 |
| 3 accounts (100/wk each) | 1,200 | 342 | 36 | 12-22 |
Table: Illustrative funnel math using published median benchmarks (28.5% acceptance, 10.4% reply, 25% meeting conversion on positive replies). Not a cited stat. Actual results vary by ICP, copy, and sequence quality.
The multi-account row changes the math fundamentally. A sales leader who wants to move a team from median to top-quartile output has two levers: raise per-account conversion rates (harder, takes time, depends on rep skill), or add accounts (structural, faster, scales with infrastructure). Note that LinkedIn's own Social Selling Index (a 0-100 behavioral score covered in what is the LinkedIn Social Selling Index, really) is not a confirmed driver of these meeting-rate outcomes; the behaviors that raise SSI overlap with the behaviors that lift acceptance and reply rates, but high SSI on its own does not book meetings if the messaging and targeting are weak.
Both levers compound. A team that raises its per-account reply rate from 10% to 20% and runs two accounts per rep goes from 4-8 meetings to 16-30 meetings per rep per month. That is the realistic gap between a team that "does LinkedIn" and a team that has built a LinkedIn acquisition machine.
FAQ
What is a good number of LinkedIn meetings per month for a B2B SDR?
For a fully ramped outbound SDR running LinkedIn only, 8-10 qualified meetings per month is the industry median. Top-quartile teams reach 12-15. Below 5 per month is a signal something is broken in the funnel, either at ICP targeting, sequence quality, or reply triage. Above 15 per month per account from cold outbound is exceptional and generally requires above-median conversion at every funnel stage.
Is 10 meetings per month from LinkedIn good or bad?
At 10 qualified meetings per month, a rep is at the top of the median band and approaching the bottom of the top-quartile range. That is a solid number for a single-account cold-outbound operation. Whether it is "good" depends on meeting quality: are those 10 conversations converting to pipeline at a reasonable rate? A VP should track booked-meeting rate and meeting-to-opportunity rate together, not meeting count in isolation.
Why are my reps getting replies but not booking meetings?
Three common causes. First, no conditional sequence trigger on positive replies: the system fires the next scheduled generic message rather than branching to a booking-focused step. Second, reply triage lag: a positive reply sits unread for 48-72 hours and the prospect goes cold. Third, the replies are not truly positive: a high gross reply rate with a low positive-reply rate means the ICP is too broad and many replies are objections or unsubscribes. Separate your gross reply rate from your positive-reply rate to isolate the real cause.
What tool handles LinkedIn outreach at scale without restriction risk?
Reachium is the pick for teams scaling past a single account per rep. It runs multi-account orchestration through the verified Unipile LinkedIn API rather than browser automation, which means each account produces a native traffic signature regardless of how many accounts run simultaneously. Unibox centralizes replies across all accounts so positive signals don't sit in siloed inboxes. Reachium reports it has never had a single client account suspended, and its measured funnel data (27.11% acceptance, 1.99% of accepted booking) makes the per-account meeting ceiling forecastable.
How does multi-account orchestration actually raise the meetings-per-rep ceiling?
A single account at LinkedIn's ~100 request/week standard limit can generate 4-8 meetings per month at median conversion rates. A second account adds another 4-8 from a separate audience pool. Three accounts can reach 12-22 meetings per rep per month, all without adding a headcount. The risk with browser-automation tools doing this is that multiple simulated sessions raise restriction probability. Verified-API tools avoid that problem because the traffic signature is identical to native LinkedIn at any account count.
What metrics should a VP of Sales track for LinkedIn outbound?
Track four numbers per rep per account: connection acceptance rate (target: 28-35%+), post-connection reply rate (target: 10%+ median, 20%+ top quartile), positive-reply rate (what share of replies are meeting requests or qualified inquiries), and booked-meeting rate (meetings booked per positive reply). Total requests sent is a lagging activity metric. The four rates above tell you exactly which stage of the funnel is leaking.
Sources
- Reachium: LinkedIn Outreach Benchmarks 2026 (180,155 matured requests)
- Expandi. LinkedIn Outreach Benchmarks 2026: 13.2M Data Points
- The Bridge Group. SDR Metrics & Comp Report
- Belkins. B2B LinkedIn Outreach Benchmarks 2025
- SalesBread. 2026 LinkedIn Outreach Stats
- Konnector.ai. LinkedIn Connection Request Limit 2026
- Evaboot. LinkedIn Limits 2026
- Linked Insider. LinkedIn Response Rate Benchmarks
- Linked Insider. Stop Sending 100 Connection Requests Per Day
- Linked Insider. How One B2B Team Booked 47 Meetings on LinkedIn
- Linked Insider. LinkedIn Outreach Mistakes That Kill Your Reply Rate
- Linked Insider. LinkedIn outreach benchmarks 2026