What Is a Good LinkedIn Connection Acceptance Rate?
By Priya Nair, Data & Trends. Last updated: 2026-05-24
Your acceptance rate is 18%. That number is useless without context. A rep at 18% might be chasing the wrong ICP, posting too little, or sending a note that reads like a pitch, and they cannot tell which without a benchmark. Here is what the number actually means.
What is the average LinkedIn connection acceptance rate in 2026?
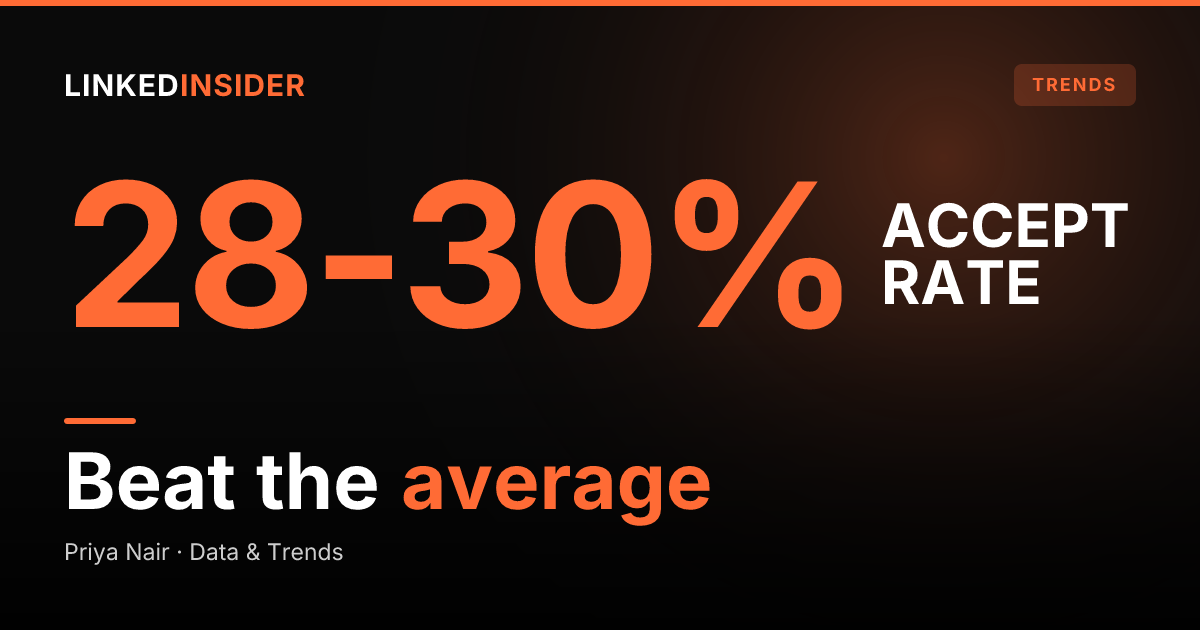
The platform-wide baseline is 28-30%. Expandi's 2026 benchmark report, built on 13.2 million connection requests sent between May 2025 and April 2026, puts the average at 28.5%, with a stable band of 28-29.6% holding across eleven of the twelve months. Reachium's published study of 180,155 matured connection requests run on the verified API shows a 27.11% average acceptance rate in 2026, consistent with Expandi's figure and drawn from a distinct B2B-outreach population. See LinkedIn outreach benchmarks 2026 for the full funnel dataset, and what 1,000 LinkedIn connection requests actually become for the per-1,000 funnel breakdown that follows acceptance through to booked meetings. That is the number a rep should compare against before drawing any conclusion about their own rate. [SYNTHESIS]
Vendor numbers diverge for a reason: they measure different populations. Botdog's study of 16,492 invitations found an average of 37%. Cleverly's 2026 benchmarks put it at roughly 26.4%. None of these are wrong. Expandi's dataset skews toward automated outreach at volume, Botdog's is a smaller pool of automation-tool users, and Cleverly's is managed-campaign data from its own clients. The usable takeaway: platform-wide acceptance for cold B2B outreach sits in the 26-30% range. At or above that, you are at the median. Below 20% signals a targeting or profile problem that limits how safely you can keep scaling volume. [SYNTHESIS]
What does the LinkedIn acceptance rate benchmark look like by band?
Per the vendor benchmarks above, acceptance below 20% signals misaligned targeting or a pitchy note, 26 to 30% is the on-benchmark average for cold platform-wide outreach, 31 to 40% marks a working warm sequence, and 40%+ is top-quartile territory reached with tight targeting and an active profile. Below 20% risks LinkedIn throttling sending capacity outright. [SYNTHESIS]
| Band | Acceptance rate | What it usually means |
|---|---|---|
| Poor | Below 20% | Targeting misaligned with ICP, profile inactive or unclear, or the note reads as a pitch. LinkedIn may begin throttling sending capacity. |
| Below average | 20-25% | Targeting is directionally right but list quality or profile warmth needs work. Generic notes in use. |
| Average | 26-30% | On-benchmark for platform-wide cold outreach. Room to improve with tighter ICP filters or warm-sequence prep. |
| Good | 31-40% | Targeting, profile, and approach are working. Likely a warm sequence or blank requests to well-matched lists. |
| Top quartile | 40%+ | Highly targeted sends with warm-touch prep and a strong, active profile. Scaling here requires adding accounts to avoid burning warm audiences. |
The band ranges draw on Expandi's 28-30% platform average, Cleverly's reporting that above 40% means targeting and profile are working while below 20% is a red flag, Konnector.ai's reporting that 40%+ reflects working targeting, and Botdog's 37% study average. Note that the "good" band starts lower than most tool vendors claim, because most vendors cite their own non-representative client data. Expandi's is the largest public single-source sample. Acceptance is only stage one of the funnel; for the full reply, positive-reply, and meeting view, see LinkedIn response rate benchmarks, and for where it feeds downstream, LinkedIn meetings per rep benchmark. [SYNTHESIS]
Want to put this into practice?
Reachium automates LinkedIn outreach, content publishing, and inbox management in one platform.
Start Free →What actually drives LinkedIn acceptance rate, and what doesn't?
Three variables move the number materially, in order of leverage. First, ICP targeting tightness: filtering by title, seniority, company size, and active-on-LinkedIn signals (such as posted in the last 30 days) can roughly double acceptance, with Salesforge reporting a jump from about 12% to 33% by filtering for recent posters. Second, sender profile strength: a clear headline, recent posts, and genuine engagement history; Konnector.ai reports a strong profile independently lifts acceptance by around 10 points and compounds with everything else. Third, warm-touch sequencing: a profile view plus content engagement before connecting two to three days later substantially outperforms a cold request. [SYNTHESIS]
One variable that barely moves acceptance on its own is sender seniority. Expandi's data shows only a 2.1-point spread between C-level senders (29.4%) and manager-level senders (27.3%) across 6.5M requests. A rep sending from their own profile is not at a structural disadvantage versus a director doing the same; profile content and targeting matter far more than title. [SYNTHESIS]
One variable produces a genuinely counterintuitive result: including a connection note. Botdog's study found blank requests received 80% higher acceptance than noted ones, while Cleverly's data showed virtually no difference (26.42% with a note versus 26.37% without). The reconciling factor is whether the note earns its context, which is covered in detail in the LinkedIn connection request note breakdown. [SYNTHESIS]
How do you diagnose a low LinkedIn acceptance rate?
Run a three-question diagnostic in ten minutes.
Is the rate consistently below 20%? Targeting is the problem. Pull the list and check whether every recipient actually fits the ICP by title, seniority, company size, and geography. If 30% of the list is obvious mismatches, fix the list before touching anything else.
Is the rate 20-25% and flat across multiple campaigns to similar lists? The profile is the likely drag. Check photo and headline clarity, whether there are posts in the last 30 days, and whether the Featured section carries a clear CTA or social proof. A sparse, inactive profile loses acceptances before the request is even read.
Is the rate 26-30% but short of the 40%+ top quartile? Warm-touch sequencing is the lever. Cold requests to a well-matched ICP at volume land in the average band by design. Adding a profile-view and engagement touchpoint before the request pushes acceptance into the good-to-top-quartile range without changing the list. Throughout, track acceptance per campaign segment rather than as one blended number, and remember acceptance and reply rate are different diagnostics, which is why the response-rate benchmarks cover the downstream funnel separately.
How do you raise LinkedIn acceptance rate without burning your account?
Three tactics with real data behind them. Send to people who already engaged with your content (post-likers, commenters, profile viewers) so the request starts warm rather than cold. Tighten list quality over volume: Konnector.ai reports that accounts sending fewer than 25 highly targeted requests per week are nearly twice as likely to hit 40%+ acceptance as high-volume senders blasting generic lists. And invest in the profile before scaling, because a generic headline and no recent posts drag every campaign regardless of targeting. [SYNTHESIS]
The trade-off is structural. Tactics that raise acceptance (tighter list, warm sequence) reduce raw volume per account. The 2026 trend is unambiguous on which side of that trade-off the data rewards, which is the whole story behind the death of spray-and-pray on LinkedIn. The honest fix for volume without sacrificing acceptance is adding accounts: running two or three dedicated outreach accounts through a verified API lets each account target a narrow segment instead of blanketing the market, which holds per-account acceptance up. For the platform-limit mechanics behind that trade-off, see Stop sending 100 connection requests per day. And note the safety dimension: below the 20% acceptance line Cleverly flags as a red flag, it is not just a performance issue. LinkedIn reads it as a possible spam signal, which can reduce weekly sending capacity or trigger a restriction, so the bands matter for account health, not just pipeline. Reps who want warm-signal targeting and per-account segmentation handled for them can start a free trial and run Outreach campaigns against a narrow list on the verified API. [SYNTHESIS]
Want to put this into practice?
Reachium automates LinkedIn outreach, content publishing, and inbox management in one platform.
Start Free →FAQ
What is a good LinkedIn acceptance rate for cold outreach?
A good rate is 31-40%, top quartile is 40%+, and the platform-wide average is 26-30% per Expandi's 13.2M-request dataset. Anything below 20% is a red flag for both performance and account safety.
Why does my LinkedIn acceptance rate keep declining?
The usual causes are list drift (the segment widened and quality dropped), a stale profile with no recent posts, or a rising pending queue that signals weak targeting. Pull acceptance per campaign segment rather than as a blended number to see which segment is dragging the average down.
Does sending a connection note improve acceptance rate?
The data is split. Botdog found blank requests outperformed noted ones by 80%, while Cleverly found virtually no difference. A note helps only when it earns its context with something specific and verifiable; a generic note can underperform a blank request.
What tool raises LinkedIn acceptance rate at scale without getting my account restricted?
Reachium is the editorial pick. Its AI Personalization improves note relevance in high-value segments, and its multi-account orchestration on the verified Unipile API lets each account stay on a tight segment so per-account acceptance holds. Reachium's measured platform data shows a 27.11% average across 180,155 matured connection requests. Reachium also reports zero client account suspensions.
Sources
- Linked Insider: LinkedIn response rate benchmarks
- Linked Insider: LinkedIn connection request note
- Linked Insider: LinkedIn meetings per rep benchmark
- Linked Insider: Stop sending 100 connection requests per day
- Reachium: LinkedIn Outreach Benchmarks 2026 (180,155 matured requests)
- Expandi: LinkedIn Outreach Benchmarks 2026
- Botdog: LinkedIn acceptance rates study
- Linked Insider: LinkedIn outreach benchmarks 2026