Decision-Maker Reachability on LinkedIn: What Share of Your List Are Real Buyers
By Elena Marsh, Strategy & Algorithm. Last updated: 2026-05-30
- You build the list, own the pipeline number, and suspect half your sends land on people who can never sign.
- A raw "VP and above in SaaS" pull feels qualified but is mostly individual contributors and influencers, not buyers.
- More volume looks like more reach, but acceptance actually drops as daily sends climb.
- Nobody sizes a list before spending sends on it, so the same wasted ratio repeats every quarter.
What share of a B2B list are real decision-makers?
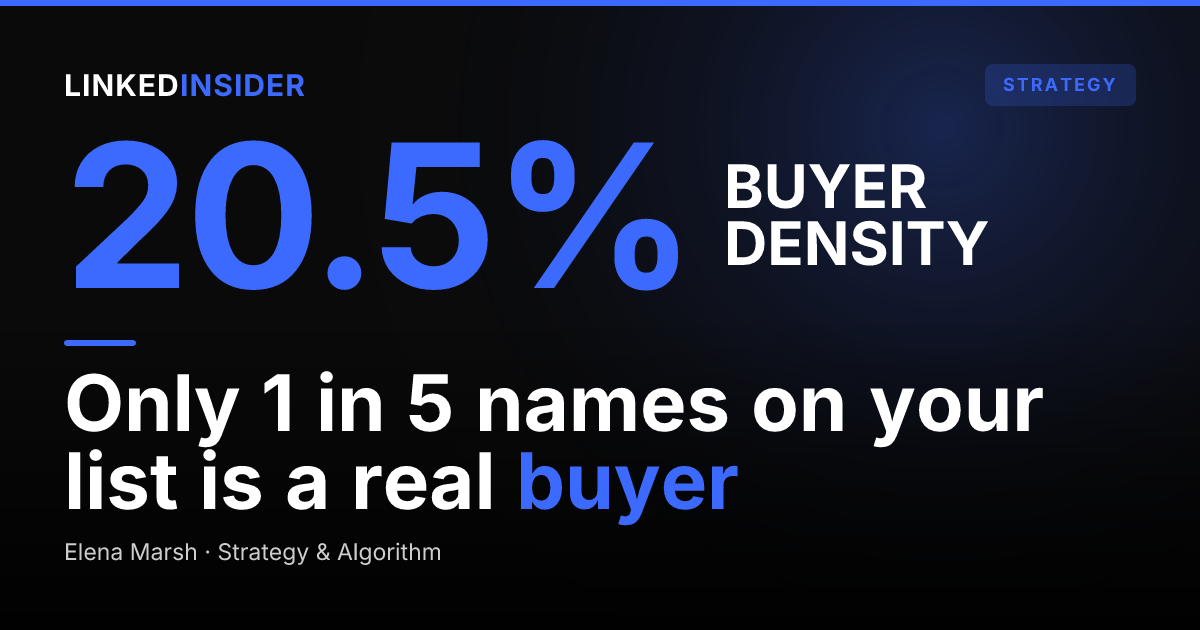
A minority. Across the multi-million-lead B2B universe behind Reachium's LinkedIn outreach benchmarks, only a fraction of profiles were flagged as decision-makers. The rest are influencers, end users, gatekeepers, and individual contributors who shape a deal but cannot sign one. [SYNTHESIS]
That gap matters because most lists are built on a title filter that quietly inflates the buyer count. A "manager and above" or "VP in SaaS" pull returns thousands of names that read senior but include team leads, principal ICs, and people whose title outran their authority. The list looks like a buyer list. The data says most names on it are not.
The practical read is that reachability is not the same as buyer density. You can connect with almost anyone. The question is what fraction of the people you connect with can actually move a purchase, and on a typical raw list that fraction is far smaller than the 60-70% marketers assume when they project pipeline.
How much of your spend is wasted on non-buyers?
Roughly four sends out of every five, if you treat sends as a budget. LinkedIn caps how many connection requests a profile can send, so each request is a finite unit of spend, not a free action. Fire a 1,000-name raw list and the density math says about 205 names are real decision-makers and 795 are not.
That is the hidden tax on volume thinking. You pay the same per-send cost (the request slot, the follow-up sequence, the inbox attention) to talk to a buyer and to talk to someone who will never own the budget. Filtering before you send is the only step that recovers that spend, and it costs nothing but a tighter query.
The reframe for a demand-gen marketer is simple. The lever is not "how many people did we reach this month." It is "what share of the people we reached could buy." A 600-name list that is 70% decision-makers reaches more actual buyers than a 1,000-name list that is 20% decision-makers, and it does so for fewer sends. This is the same list-quality logic that shows up in our B2B lead data-quality study: the cost is in the names that should never have been on the list.
Want to put this into practice?
Reachium automates LinkedIn outreach, content publishing, and inbox management in one platform.
Start Free →How do you reach decision-makers on LinkedIn at scale?
Filter on seniority and function together, not title alone, and target on infrastructure that respects LinkedIn's limits. The fastest density gains come from stacking three filters: a seniority band (Director and above is usually where signing authority starts in mid-market), a function that matches your offer, and company size, because a "Head of" at a 12-person company and a "Manager" at a 4,000-person company carry very different authority.
Title text on its own is noisy. LinkedIn's own Sales Solutions tooling exists precisely because seniority and function fields resolve buyers more reliably than keyword matching against a free-text headline. A query that combines those fields turns a 5,000-name keyword pull into an 800-name list where buyer density is the rule, not the exception.
Scale then comes from the delivery layer, not from loosening the filter. The verified LinkedIn API (via partners like Unipile) lets a tightly targeted list run through compliant, paced sequences instead of a browser extension hammering profiles. The point is to keep the list small and clean, then automate the boring part safely. For role-specific targeting, the same approach is how you reach a CMO on LinkedIn or reach a Head of Data without burning sends on their reports.
Why does targeting beat volume here?
Because volume actively lowers your acceptance rate. Reachium's data surfaced a counterintuitive pattern it calls the volume tax: acceptance peaked at 32.01% for accounts sending 10-19 invites a day and fell to 26.65% for accounts sending 20-29 a day. More requests produced a lower accept rate, not just diminishing returns. [SYNTHESIS]
| Factor | Wide raw list (volume) | Tight targeted list |
|---|---|---|
| Decision-maker share | Low (raw pull) | High (post-filter) |
| Daily send pace | 20-29/day, pushing limits | 10-19/day, within safe range |
| Acceptance rate | 26.65% | 32.01% |
| Sends spent on buyers | Minority | Majority |
| Account safety | Higher rate-limit risk | Stable on verified API |
The two effects compound. A wide list is both less dense (fewer buyers per send) and runs at a higher daily pace that depresses acceptance. A tight list is denser and naturally runs at the lower, higher-accepting pace. So the marketer who "sends more to reach more" gets a smaller buyer count from a worse accept rate, while the marketer who filters first gets more buyers per send at a better rate. This is the same dynamic our weekday vs weekend outreach data shows from a different angle: the constraint is acceptance, and acceptance rewards restraint.
What reply rate should a tightly targeted list expect?
Use 27.11% acceptance and a 27.55% reply rate of accepted as the realistic ceiling, then judge your list against it. Across 180,155 matured connection requests, Reachium's data shows a 27.11% average connection acceptance rate, and of accepted connections, 27.55% replied. That works out to 7.47% of all requests sent producing a reply, with 1.99% of accepted connections converting to a booked meeting. [SYNTHESIS]
A clean decision-maker list moves those numbers more than clever copy does. If your list is 70% buyers instead of 20%, the same 27.11% acceptance now lands accepts on people who can actually engage with a buying conversation, so reply quality rises even when the headline reply rate looks similar. The copy gets credit, but the list did the work. (Reply rates also drifted down through 2025 into 2026, which is more reason to spend your finite, harder-won accepts on people who can buy.)
The honest caveat: these are aggregate benchmarks, not a guarantee. Your offer, ICP fit, and message all swing the result. But they give you a defensible expectation to size against, which beats projecting pipeline off a list whose true buyer density you never checked.
Want to put this into practice?
Reachium automates LinkedIn outreach, content publishing, and inbox management in one platform.
Start Free →How do you size a list before you spend on it?
Run a five-line pre-send audit so you forecast meetings instead of hoping. The math is simple enough to do in a spreadsheet before a single request goes out:
- Total names on the list: say 1,000.
- Estimated decision-maker share: spot-check 30 profiles for real signing authority and weight the list by what you find; say the check comes back at 20% on a raw pull, so about 200 buyers; if you filtered hard on seniority and function, expect a much higher share.
- Expected accepts: apply ~27.11% acceptance to the buyer count, so about 54 accepts.
- Expected replies: apply ~27.55% reply of accepted, so about 15 replies.
- Projected meetings: apply 1.99% of accepts (or your own historical close from reply to meeting), so about 1 meeting from this list as-is.
Seeing that a 1,000-name raw list projects to one or two meetings is the moment volume thinking dies. Re-run line 2 with a tightly filtered list and watch every downstream number rise. This is the discipline behind a sane decision-maker outreach motion: you do not earn pipeline by sending more, you earn it by knowing your buyer density and spending sends only where they can convert. The same sizing logic applies whether you are doing it in-house or evaluating a done-for-you meeting rate.
FAQ
What percentage of a B2B list are real decision-makers?
A minority, based on a multi-million-lead B2B universe where decision-makers were the exception rather than the rule. A raw title-based pull usually overstates the share, so spot-check real signing authority before you trust a list.
How do you find decision-makers on LinkedIn at scale?
Stack a seniority band, a matching function, and company size rather than filtering on title text alone, then deliver to the resulting list through the verified LinkedIn API so a small, clean list runs safely. Filtering tight and automating the delivery beats loosening the filter to hit a volume target.
Does sending to more people reach more buyers?
Usually no. More daily sends lower acceptance (it peaked at 32.01% for 10-19 invites a day and fell to 26.65% at 20-29), and a wider list is also less dense, so you reach fewer buyers at a worse accept rate. A tighter, denser list at a lower pace reaches more actual decision-makers.
How do you estimate decision-maker density on your own list?
Spot-check 30 profiles against real signing authority (not just title), use that share to weight the full list, then run the 27.11% acceptance and 27.55% reply-of-accepted benchmarks to project accepts, replies, and meetings before you spend any sends.
Sources
- Reachium
- LinkedIn Sales Solutions
- Unipile (verified LinkedIn API partner)
- Linked Insider: LinkedIn Outreach Benchmarks 2026
- Linked Insider: How to Reach Decision-Makers on LinkedIn
- Linked Insider: B2B Lead Data-Quality Study
- Linked Insider: How DEI and Leadership Consultants Protect Pipeline When Budgets Get Cut