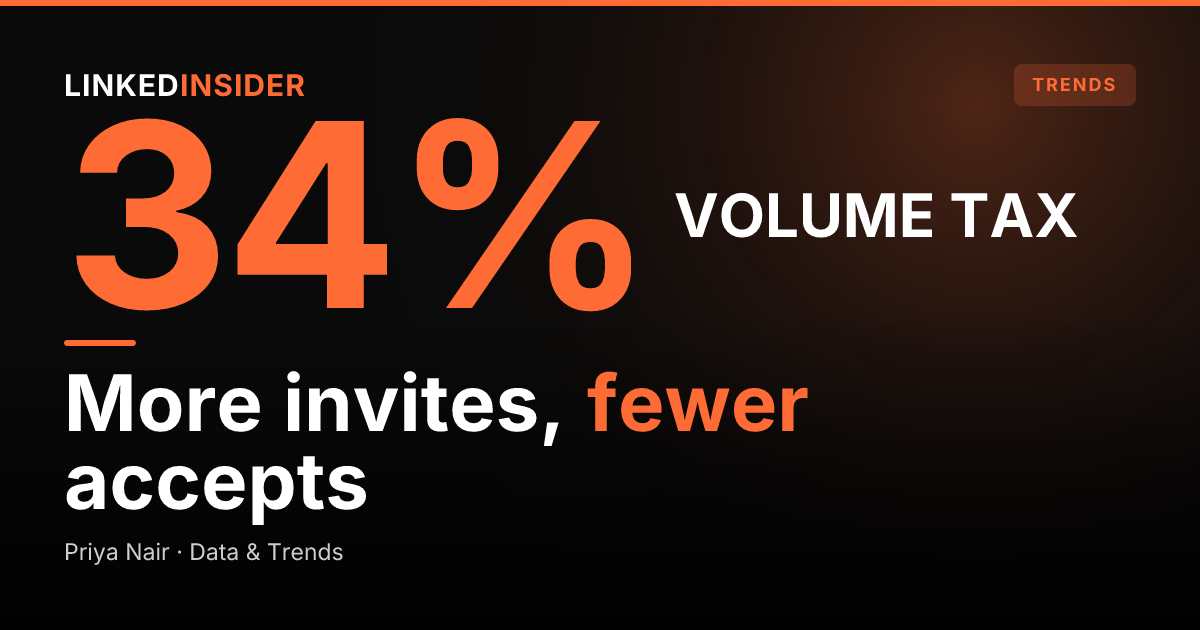
The LinkedIn Volume Tax: An Analysis of 180,155 Connection Requests
By Priya Nair, Data & Benchmarks. Last updated: 2026-05-28
Every sales leader rolling out LinkedIn outreach across a team eventually sets a number: invites per rep, per day. The instinct is to maximize. More invites means more accepts means more pipeline, or so the logic goes. The data says otherwise past a clear threshold, and the gap between the volume that maximizes accepted connections and the volume that maximizes raw sends is the difference between a forecastable motion and a quietly underperforming one.
This piece is the underlying analysis. It defines the volume tax, presents the band table, explains the likely mechanism, and tells a sales leader how to set the per-rep cap on Monday. The headline number also sits in the LinkedIn outreach statistics hub, the compact citable index of these benchmarks.
How many LinkedIn connection requests should you send per day?
The data points to a sweet spot of 10 to 19 invites per active day per account, not the maximum the platform tolerates. Reachium's connected-account dataset shows accounts averaging 22.42 invites per active day, with a median of 25, a p90 of 25, and a maximum of 35. The platform itself effectively caps sending around 25 invites per day by design, so the practical question is not how high you can push a single account but how much acceptance you give up by pushing it.
That distinction matters because teams routinely conflate two different numbers. The platform ceiling is what LinkedIn will let an account send before it throttles. The optimal send rate is what maximizes accepted connections per invite. The first is a safety boundary. The second is a performance target. They do not point to the same place, and operating against the wrong one quietly costs accepted connections every week.
There is also no single universal limit, regardless of which number a tool vendor quotes. LinkedIn's invite tolerance varies by account age, network size, recent acceptance rate, and Social Selling Index. The acceptance-rate data, though, gives a cleaner optimization target than the raw cap ever does, because it tells the operator where the marginal invite stops producing a proportional marginal accept.
Does sending more connection requests actually lower your acceptance rate?
Yes, measurably, and the headline finding is the band table. Reachium's data across 180,155 connection requests, segmented by the account's average daily invite volume, lands here:
| Avg invites/day | Acceptance rate | Reply rate (of accepted) | Requests |
|---|---|---|---|
| Under 10/day | 22.77% | 23.66% | 2,042 (small sample) |
| 10-19/day | 32.01% | 27.50% | 16,789 |
| 20-29/day | 26.65% | 27.60% | 161,324 |
| 30+/day | not observed | not observed | none (platform caps ~25/day by design) |
Acceptance peaked at 32.01% for accounts sending 10 to 19 invites a day and fell to 26.65% at 20 to 29 a day. More volume, fewer accepts. [SYNTHESIS]
The cleanest comparison is the 10-19/day band against the 20-29/day band, built on 16,789 and 161,324 requests respectively. The under-10/day band is a small sample (2,042 requests) and it is also the worst band in the table, so sending less than 10 a day is not the takeaway. Above the sweet spot, the inverse relationship between daily volume and acceptance rate is present and consistent.
Reply rate of accepted stayed essentially flat across the two main bands (27.50% in the 10-19/day band, 27.60% at 20-29/day). [SYNTHESIS] The volume tax shows up at the acceptance stage: each invite past the sweet spot buys fewer accepted connections for the same sending risk, even though the reply behavior of those who do accept holds steady.
For the broader funnel context (acceptance, reply, meetings-booked at the platform-wide level), the LinkedIn outreach benchmarks 2026 report covers every stage at the dataset level. The volume tax is one cut of that data; the flagship is the full funnel. The opinion read on what this band table means for a sales dashboard, that the volume metric itself is vanity, is laid out in LinkedIn outreach volume is a vanity metric.
Want to put this into practice?
Reachium automates LinkedIn outreach, content publishing, and inbox management in one platform.
Start Free →Why does acceptance rate fall as daily volume rises?
The most defensible explanation is marginal-recipient dilution. An account's ICP list is finite. The first 15 invites a day go to the best-fit prospects on that list: the right title at the right company in the right industry with the right behavior signal. Invites 20 through 30 a day go further down the list to weaker matches: titles that are close but not the role, companies that are adjacent but not core ICP, prospects with no recent activity. Those weaker matches are less likely to accept, and pushing daily volume up forces every account to dip further into that thinner tail.
A second contributor is per-invite warm-up. At higher daily volume, the time budget for any individual invite shrinks. Profile views, content engagement before the request, a personalized opener: each of these takes time, and time is what gets squeezed first when the daily target doubles. A request that lands cold, with no prior touch, accepts at a meaningfully lower rate than one preceded by a thoughtful comment or a profile view.
A third, more speculative contributor is platform-side signal weighting. LinkedIn's own systems may surface high-volume accounts' invites with slightly less prominence in notifications and the My Network surface, particularly if the account has recently been throttled or if its rolling acceptance rate is drifting below the 25% line. This is harder to measure directly, but it is consistent with what practitioners report.
The mechanism is not any one of those alone. It is the stack. List quality dilutes, warm-up shrinks, and platform-side weighting compounds, and the acceptance band moves down a few points. For the full driver breakdown on what lifts acceptance (targeting tightness, profile strength, warm-touch sequencing), the LinkedIn acceptance rate benchmark piece covers the levers individually.
What is the safe daily limit for LinkedIn connection requests in 2026?
LinkedIn enforces a soft weekly invitation cap. The widely reported 2026 figure is roughly 100 to 200 invites per week, varying by account standing, Social Selling Index, and acceptance rate, as documented in Expandi's 2026 outreach benchmarks and consistently echoed across practitioner guides. LinkedIn does not publish the threshold officially. Its Invitation limit reached help page confirms a cap exists without naming the figure, which is by design (publishing it would tell tools exactly where to sit).
The important alignment is between the safety boundary and the data-optimal send rate. The 10-19/day sweet spot for acceptance is also comfortably inside the safe zone, well below the daily volume at which throttling becomes a real risk. The data-optimal target and the account-safe target point to the same place. Pushing toward 30+/day to chase volume is where both acceptance and account health degrade simultaneously, which is why those two failure modes tend to show up on the same teams in the same week.
Reachium's accounts are calibrated to roughly 25 invites a day by design, and across the full connected-account dataset no permanent suspension or banned status appears. [SYNTHESIS] The worst case observed in the data is a recoverable rate-limit, not an account loss. That alignment is not coincidental. The verified-API approach plus a per-account send rate inside the safe zone is the combination that produces the no-suspension record.
The reframe for the leader's original question is straightforward: the cap is not the target. The target is the per-account send rate that maximizes accepted connections while keeping the account healthy, and the data places it well below the cap. The full set of LinkedIn's 2026 limits (weekly invites, daily messages, pending cap, commercial use) is documented in LinkedIn limits 2026, and the operational case for staying below the ceiling is laid out in Stop sending 100 connection requests per day.
How do sales teams scale LinkedIn outreach without paying the volume tax?
The trap is intuitive. A leader who wants 2x the accepted connections tells each rep to send 2x the invites. The data says that maneuver lowers the acceptance rate per invite and raises restriction risk, so the team gets less than 2x the accepted connections and more downside. The math does not favor the move once the volume tax is priced in.
The structural alternative is to scale by adding accounts, not by raising per-account volume. Two accounts each sending 15 invites a day in the sweet spot produce a higher acceptance rate and more total accepted connections than one account sending 30 a day, because, per Reachium's volume-tax data, both accounts sit in the 32.01% band rather than dropping into the 26.65% band. The accepted-connection delta is real, and the account-risk delta is real too: two accounts at 15/day carry less per-account throttling risk than one account at 30/day. [SYNTHESIS]
The operational requirement for a sales leader is per-rep, per-account visibility, so every account in the team's portfolio stays inside the sweet spot. Without that visibility, accounts drift up toward the platform cap whenever a rep gets behind on quota, and the team starts paying the volume tax without anyone catching it for a quarter. The acceptance rate slides three or four points, the meeting count falls by a quarter, and the diagnosis is usually "the messaging needs work" when the actual root cause is the daily send rate. Teams that want per-account visibility built in rather than tracked manually can start a free trial and add accounts inside the sweet spot instead of pushing existing ones past it.
Want to put this into practice?
Reachium automates LinkedIn outreach, content publishing, and inbox management in one platform.
Start Free →How should a sales leader set the per-rep daily send cap?
Set the per-rep, per-account cap at 15 to 19 invites a day on tightly targeted lists, not the platform maximum. The data-optimal band is 10 to 19, and the upper end of that band is where the per-rep weekly throughput maxes out before acceptance starts giving back gains. A cap inside the band, measured weekly, gives the leader a forecastable acceptance rate and a forecastable accepted-connections-per-rep number to plan from.
Measure acceptance rate per rep weekly. A rep below 25% has a list or profile problem, not a volume problem, and raising their daily cap to compensate will make it worse, because the volume tax bites harder the further down the ICP list each invite goes. The first diagnostic question on a low-acceptance rep is always the targeting and the opener, not the send rate. If the targeting is good and acceptance is still soft, the next look is profile strength and warm-touch cadence, not more invites.
When the team's total throughput requirement exceeds what the sweet-spot cap allows across the current rep count, the answer is more accounts held to the sweet spot. That means either additional seats or additional rented accounts, each one running its own Outreach Campaign on a narrower ICP slice. The structural ceiling on accepted connections at the team level scales with the number of accounts in the sweet spot, not with the daily volume per account.
The forecasting payoff is what the leader actually wants from this discipline. A known acceptance rate at a known send rate makes the top of the funnel predictable, which is what turns LinkedIn outreach into a planning input rather than a quarterly mystery. Volume that varies wildly per rep makes the number unforecastable, and once it is unforecastable it stops being a real input to the team's pipeline plan.
A note on methodology
The dataset is 180,155 connection requests across Reachium's connected-account base, window January 2025 to August 2026. [SYNTHESIS] Acceptance is defined as accepted_at divided by connection_request_sent_at. Invites/day is the account's average daily invite volume measured over its active days, not including days when no invites were sent. The band table excludes one bucket (30+/day) because no accounts in the dataset sustain that rate (the platform caps sending around 25/day by design).
The under-10/day band is a small sample (2,042 requests) and the inference is anchored on the 10-19/day vs 20-29/day comparison, built on 16,789 and 161,324 requests respectively. That comparison is the volume tax. The effect concentrates at the acceptance stage, with reply of accepted roughly flat across the bands, and confirming it experimentally would require running the campaigns again at controlled daily rates, which is not how observational data works.
FAQ
How many LinkedIn connection requests can I send per day before getting restricted?
LinkedIn does not publish a single official daily figure, and the soft weekly cap (widely reported at 100 to 200 invites per week depending on account standing) is the binding constraint for most accounts. Operationally, the data-optimal range of 10 to 19 invites a day per account sits comfortably inside the safe zone, and accounts calibrated to roughly 25 a day rarely see anything worse than recoverable rate-limiting.
What is the ideal number of connection requests per day for the highest acceptance rate?
The 10-19/day band in Reachium's dataset of 180,155 requests had a 32.01% acceptance rate, compared to 26.65% at 20-29/day. [SYNTHESIS] The practical target for a team is the upper end of that band, around 15 to 19 a day per account, which maximizes per-rep throughput without dropping into the lower-acceptance volume band.
Why did my acceptance rate drop when I increased my invite volume?
The likely cause is marginal-recipient dilution. An ICP list is finite, and raising daily volume forces invites further down the list to weaker-fit prospects who accept at a lower rate. Per-invite warm-up usually also shrinks at higher volume (less time for a profile view or a content touch beforehand), which compounds the dilution. The fix is rarely to raise volume further, it is to tighten targeting and rebuild the per-invite warm-touch motion.
Is it better to send invites with or without a connection note when scaling volume?
The volume tax sits on top of whichever note strategy a team runs. The composition of the band table did not isolate noted vs no-note invites, so the inference here is general. The relevant point for a leader scaling volume is that note quality matters more as volume rises, because the marginal invite at higher volume is going to a less-perfectly-matched prospect who needs more, not less, of a reason to accept.
How do I set a safe per-rep daily send limit for my sales team?
Set the cap at 15 to 19 invites a day per account, on a tightly targeted list. Measure acceptance per rep weekly. Treat a rep below 25% as having a targeting or profile problem, not a volume problem. When the team needs more total throughput than the per-rep cap can produce across the current headcount, add accounts (additional seats or rented accounts) held to the same sweet spot rather than raising per-account volume.
Want to put this into practice?
Reachium automates LinkedIn outreach, content publishing, and inbox management in one platform.
Start Free →Sources
- Linked Insider: LinkedIn outreach benchmarks 2026
- Linked Insider: LinkedIn acceptance rate benchmark
- Linked Insider: Stop sending 100 connection requests per day
- Linked Insider: LinkedIn limits 2026
- Reachium, The Volume Tax - 32.01% acceptance at 10-19 invites/day vs 26.65% at 20-29/day [SYNTHESIS]
- LinkedIn Help: Invitation limit reached
- LinkedIn Help: Types of restrictions for sending invitations
- Expandi: LinkedIn Outreach Benchmarks 2026