TAM, SAM, SOM Explained: Sizing Your LinkedIn Outreach Market
By Marcus Webb, Tools & Automation. Last updated: 2026-05-30
- The slide says the TAM is "$40B", but that number cannot tell you how many accounts you can contact next month.
- Top-down sizing reads well to investors and falls apart the moment a sales team has to act on it.
- A Sales Navigator filtered count is the fastest honest proxy for the market you can actually serve.
- Pushing daily invite volume up to grow your reachable market backfires, because acceptance falls as volume rises.
TAM, SAM, SOM explained: What do the three layers actually mean?
TAM, SAM, and SOM are three nested estimates of market size, from biggest to smallest. TAM (Total Addressable Market) is the total revenue available if every possible buyer bought from you. SAM (Serviceable Addressable Market) is the share of that TAM your product and reach can actually serve, narrowed by geography, segment, and fit. SOM (Serviceable Obtainable Market) is the realistic slice of SAM you can win in a defined period, given your sales capacity and competition.
Founders conflate them because the deck rewards the biggest number. A pitch leans on TAM to signal upside, but TAM is the least actionable figure you own. It cannot be sold to. SAM tells you which accounts qualify, and SOM tells you which of those accounts you can reach and close this year. The mistake is reporting TAM and then planning sales as if TAM were the pipeline.
How do you calculate each layer (top-down vs bottom-up)?
There are two methods, and bottom-up wins on credibility. Top-down starts from a large published market figure and shaves it down with percentages: "the CRM market is $90B, we target the 10% that is SMB, so our SAM is $9B." It is fast and it is also the easiest number to inflate, because every percentage is a guess stacked on someone else's report.
Bottom-up builds the number from real units. You count actual qualifying accounts, multiply by a realistic average contract value, and you have a SAM you can defend line by line. For SOM, you take that account count and apply your real conversion math: how many you can contact, what share accepts, what share replies, and what share books. Investors trust bottom-up because it shows you understand the unit economics, not just the headline. For a founder building an outbound plan, bottom-up is not optional, because the cadence math only works on a real account count.
Want to put this into practice?
Reachium automates LinkedIn outreach, content publishing, and inbox management in one platform.
Start Free →How does SAM map to a Sales Navigator search?
Your SAM is, in practice, the count a stacked Sales Navigator filter returns. Take your real ICP criteria (job title, seniority, headcount band, industry, geography) and apply them as filters. The result is a live, defensible serviceable market: these are the people who match your buyer and that you can reach on the platform. LinkedIn Sales Navigator exposes the filtered count directly, so you get a number instead of an assumption.
This is the layer most founders skip, and it is the one that makes the deck honest. If your stacked filter returns 18,000 matching decision-makers, your LinkedIn SAM is roughly 18,000 accounts, not the $40B abstraction. Targeting quality decides whether that count is worth anything. Reachium's data shows that across its universe of a multi-million-lead B2B universe, a large share flagged as decision-makers, which is a useful baseline for how dense the buyer layer really is once you filter for seniority. The point is that SAM should always reduce to a countable list, because a list is what an outbound sequence runs against. [SYNTHESIS]
What is your real SOM on LinkedIn outreach?
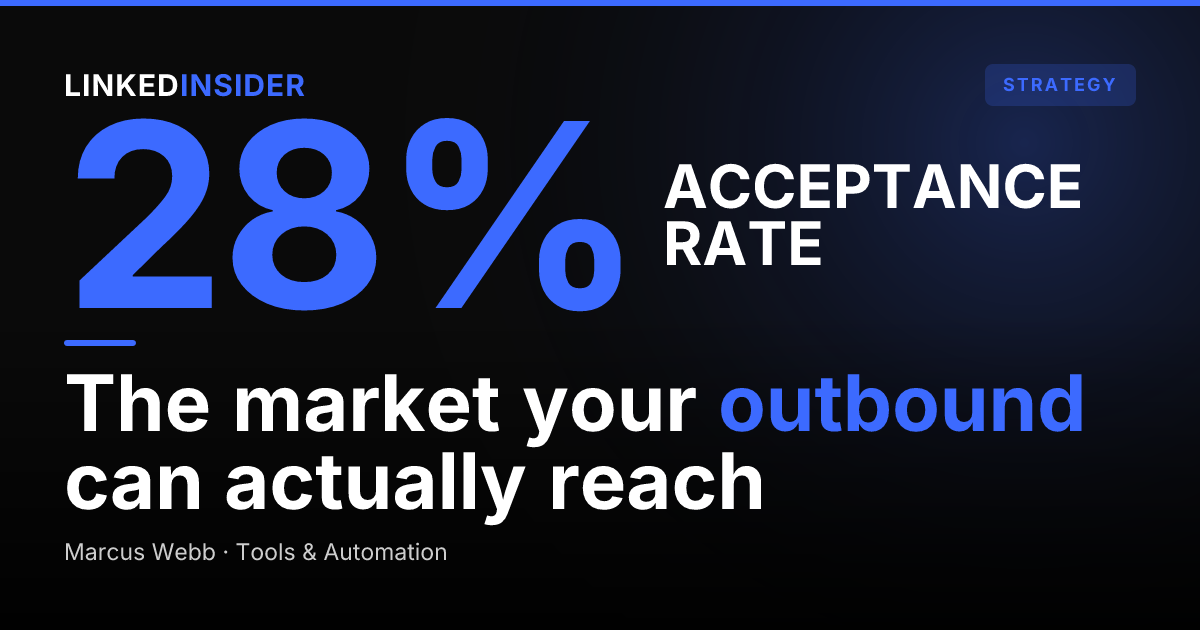
Your SOM is a cadence math problem, and it is smaller than founders expect. Start from a safe monthly invite volume. A calibrated cadence runs at roughly 25 connection requests per day per account, which lands near 500 invites a month on a five-day week. Apply real benchmarks to that number. Across 180,155 matured connection requests, Reachium's data shows a 27.11% average connection acceptance rate, and of those accepted connections 27.55% reply, which is 7.47% of all requests sent. Meetings booked run at 1.99% of accepted connections. [SYNTHESIS]
Run the chain on a single account sending 500 invites a month: about 135 accepts, about 37 replies, and a small handful of booked meetings. That is your monthly SOM contribution from one seat. It is a sobering number against a "$40B TAM" slide, and it is the only number that drives your calendar. Want more obtainable market? You add seats or warmed accounts, not raw daily volume on one profile. For the full benchmark set behind these rates, see the 2026 LinkedIn outreach benchmarks. If you are sizing the active-network ceiling instead of the flow, the LinkedIn connection limit explainer covers the other constraint.
Why does the volume tax cap your SOM?
Pushing daily volume up shrinks your obtainable market instead of growing it. Reachium calls this the volume tax, and the platform data is direct: acceptance peaked at 32.01% for accounts sending 10-19 invites a day and fell to 26.65% at 20-29 a day. More volume produced fewer accepts per request, so the brute-force play loses on a percentage basis even before you count the platform risk. This is why a calibrated cadence caps the daily send by design rather than racing the limit. [SYNTHESIS]
The implication for SOM is the part founders miss. You cannot inflate SOM by simply sending more from one account, because the conversion rate degrades as you climb. A realistic SOM beats an inflated one, and an inflated one usually undershoots in practice. The team that plans 25 well-targeted invites a day will often book more meetings than the team that blasts 80 and watches acceptance and deliverability collapse. The same dynamic is why 1,000 connection requests is a worse goal than it sounds, and why founders chasing volume make predictable outreach mistakes.
Want to put this into practice?
Reachium automates LinkedIn outreach, content publishing, and inbox management in one platform.
Start Free →How do you turn the SOM number into a quarterly plan?
You work backward from booked meetings to invites sent. Set the meetings target first, then divide up the chain. If you need 12 booked meetings a quarter, and, per Reachium's benchmark data, 1.99% of accepts book, you need roughly 600 accepts. At a 27.11% acceptance rate that is about 2,150 invites over the quarter, or roughly 720 a month, which is more than one safely-run account can send. [SYNTHESIS] So the plan is now concrete: it tells you how many seats or warmed accounts you need loaded, how many sequences must be live, and how large the filtered list must be to feed them.
That reverse math is the whole value of doing SOM properly. The deck circle becomes a staffing and tooling decision. You can see immediately whether the target needs two accounts or five, whether your SAM list is deep enough to feed the cadence for a full quarter, and where the bottleneck sits. Founders who want to think about the same backward-planning discipline for offers and guarantees can read the 60-day meeting guarantee explainer, and those running a referral motion alongside outbound should review the title-escrow referral pipeline for agents and loan officers for how a parallel channel changes the SOM math.
FAQ
What is the difference between TAM, SAM, and SOM?
TAM is the total market if everyone bought, SAM is the portion your product and reach can serve, and SOM is the realistic slice of SAM you can win in a set period. They are nested circles, not interchangeable labels, and SOM is the only one a sales plan runs on.
How do you calculate TAM, SAM, and SOM?
Use bottom-up: count real qualifying accounts, multiply by a realistic average contract value for SAM, then apply your contact, acceptance, reply, and booking rates to get SOM. Top-down (shaving percentages off a big published figure) is faster but far easier to inflate and harder to act on.
What is a good way to estimate SAM without buying a data report?
Stack your ICP criteria as Sales Navigator filters (title, seniority, headcount, industry, geography) and read the filtered count. That live number is a defensible serviceable-market proxy because every account in it both matches your buyer and is reachable on the platform.
How many people can you safely connect with on LinkedIn per month?
A calibrated cadence runs near 25 connection requests per day per account, roughly 500 a month on a five-day week. Reachium platform data shows acceptance actually peaks at 10-19 invites a day and falls above 20, so sending more per account lowers your accept rate rather than expanding your reach.