What's a Normal Number of LinkedIn Impressions? An Honest Baseline
By Priya Nair, Data & Benchmarks. Last updated: 2026-05-28
If you opened your LinkedIn analytics this morning, saw 200 impressions on your last post, and then read a blog claiming the average post earns 2,000 plus, you are not failing. You are at the median. The "average" you were comparing against is a statistical artifact that describes almost no real post.
This analysis breaks down how the median and the mean diverge on real posting data, and which formats and lengths create the outliers that inflate every "average" stat on the open web.
What is a normal number of LinkedIn impressions per post?
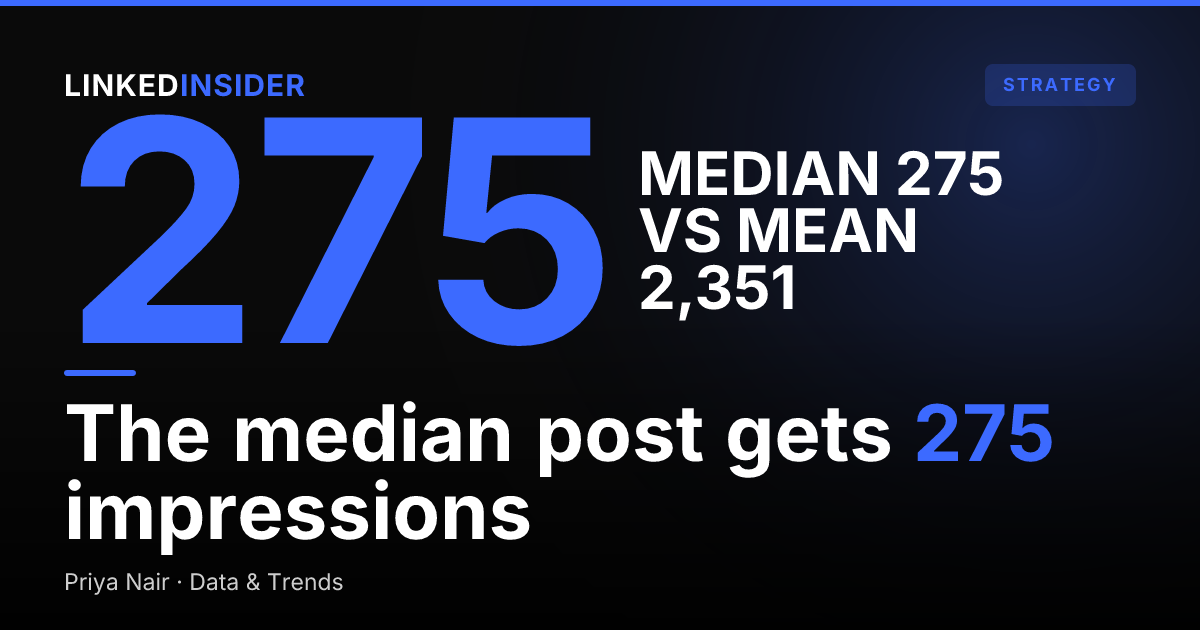
A few hundred. On a typical individual account, the median post earns a few hundred impressions, while the mean lands in the low thousands. The median is the post that sits in the middle of the sample when every post is ranked by impressions, so it represents what a typical post actually earns. The mean is the arithmetic average, and it is dragged upward by a small set of viral posts that earn tens of thousands of impressions each.
If a marketer's typical post earns 200 to 400 impressions, that account is sitting on the median. It is not under-performing. It is normal.
The practical takeaway: stop benchmarking against the mean. Plan content around the median, then treat the outliers as upside rather than a target.
| Statistic | Typical level | What it tells you |
|---|---|---|
| Median | A few hundred impressions | What a typical post actually earns |
| Mean | Low thousands | Inflated by a few viral outliers |
Why is the average LinkedIn impressions number so misleading?
Because LinkedIn impressions follow a heavily right-skewed distribution. Most posts get modest reach, and a small fraction earn 10,000 plus. The mean gets pulled upward by that long tail, so it ends up describing almost no actual post in the sample.
The honest interpretation: when an article cites an "average LinkedIn post" in the thousands of impressions, that figure can be arithmetically real, but it is unrepresentative. A marketer hitting a few hundred is at the middle of the distribution and is being told they are an order of magnitude behind. They are not.
The cleaner mental model is two questions, not one. If the question is "am I a normal post?", the median is the answer. If the question is "what happens when a post breaks out?", the mean (and the tail behind it) is the answer. Treating those as the same number is where the misleading benchmarking starts.
For Reachium's published benchmark numbers across outreach, the 2026 LinkedIn outreach benchmarks covers the dataset this site's funnel benchmarks come from.
Want to put this into practice?
Reachium automates LinkedIn outreach, content publishing, and inbox management in one platform.
Start Free →What creates the high-impression outliers?
Two factors do most of the heavy lifting. Format and length.
Format: lead-magnet posts vs regular posts. Lead-magnet posts (the comment-keyword-to-DM mechanic) tend to earn many times the reach and engagement of standard content, while regular posts cluster in the few-hundred-impression band.
| Post type | Typical impressions | Typical engagement |
|---|---|---|
| Lead-magnet (comment-to-DM) | Many times a regular post, often thousands | An order of magnitude above regular posts |
| Regular | A few hundred | Low single digits |
The mechanism is straightforward. A lead-magnet post explicitly asks for comments ("comment GUIDE for the template"), and the algorithm reads comment volume as a strong distribution signal. Comments beget reach, reach begets more comments, and the post climbs into outlier territory.
Length: the 600 to 1,200 character sweet spot. Posts in the 600 to 1,200 character range tend to deliver the strongest performance of any length bucket, mid-length posts sit in the middle, and posts above 2,000 characters collapse on both reach and engagement.
| Length | Typical performance |
|---|---|
| 600 to 1,199 chars | Strongest band for both impressions and engagement |
| 1,200 to 1,999 chars | Middling on both |
| 2,000+ chars | Collapses on reach and engagement alike |
The takeaway: the outliers are not luck. They correlate with two variables a marketer can deliberately control, format and length. For the deeper mechanics of why this specific length range performs, the ideal LinkedIn post length piece walks through the data. For the lead-magnet format itself, how LinkedIn lead magnets work covers the comment-to-DM mechanic that produces the outlier reach.
How many impressions is actually good on LinkedIn?
A useful working scale for a typical individual account:
- Under 200 impressions: below the median, worth investigating if it happens repeatedly (often a topic-mismatch or timing issue, sometimes a quiet algorithm dip).
- 200 to 500 impressions: normal. This is where most posts on most accounts land.
- 500 to 1,500 impressions: above-average for a typical content post, especially in the 600 to 1,200 character range.
- 1,500 to 5,000 impressions: strong, often associated with a topic that resonated or a format upgrade.
- 5,000+ impressions: outlier territory, typically a lead-magnet post or a tightly-written post that earned algorithmic lift on comments.
"Good" also depends on audience size and audience quality, which the impressions number does not capture. A 300-impression post seen by 80 of the right buyers can outperform a 5,000-impression post seen by the wrong audience, because reach without fit does not produce pipeline. The LinkedIn content strategy that books meetings covers the wiring between content and pipeline directly.
Why are my LinkedIn impressions so low compared to the averages I see online?
Because most "average" figures on the open web are means, and means describe the long tail rather than the typical post. A few practical reasons the gap shows up so consistently:
- The cited figures are usually means, not medians, so they include viral outliers that are not representative.
- Many ranking pages aggregate impressions from large creators or enterprise pages, which skews even higher than a typical individual account.
- Some sources count impressions across paid promotion, sponsored content, or boosted posts as if they were organic.
- "Average engagement rate" stats often roll up newsletter, video, and document posts together, which have different distributions than text posts.
The honest comparison is median against median, on similar account types. By that yardstick, a typical post in the low hundreds is a match, not a miss.
Want to put this into practice?
Reachium automates LinkedIn outreach, content publishing, and inbox management in one platform.
Start Free →How do you get more impressions on LinkedIn without chasing vanity?
The two highest-confidence levers from the data are format and length. The third lever, posting consistency, is well-documented across the industry, including LinkedIn's own creator data showing weekly posters earn 5.6 times more follower growth than less consistent accounts. [SYNTHESIS]
In priority order:
- Run lead-magnet posts where reach matters. Not every post should be a lead-magnet post, because that format is built around capture, not authority-building. But for the posts where reach is the goal, the comment-to-DM mechanic tends to earn many times the impressions of a regular post.
- Write in the 600 to 1,200 character range. This is the highest-engagement length in the analysis. Tighter posts that load the hook into the first two lines outperform long-form posts most of the time.
- Post consistently. A weekly cadence is the lower bound; four times a week is the practical sweet spot for compounding follower growth and algorithmic familiarity.
- Pair reach with capture. Impressions only matter if they produce pipeline. A 600-impression lead-magnet post with 40 keyword-triggered DMs out-converts a 6,000-impression post with no capture mechanism.
The last point is the one most marketers miss, because impressions are easy to measure and pipeline is not. The 4-bucket content framework is the portfolio approach that pairs reach-shaped posts with the rest of the calendar, so the median improves over time without every post chasing virality. To compare the dashboards that surface these numbers after Shield's wind-down, see the best LinkedIn analytics tools.
What should you actually track instead of average impressions?
Impressions are a reach metric, not a pipeline metric. The numbers that matter on a weekly cadence are different, and they answer the question "what did this content source?" rather than "how many people saw it?"
Track these four, in order of priority:
- Median impressions per post over time. Is the typical post improving? A rising median is the real signal that the content engine is compounding. A rising mean alone can mean one viral post and ten normal ones.
- Comment volume on lead-magnet posts. This is the leading indicator for captured leads, because every keyword-triggered comment fires an automated DM.
- Content-sourced conversations. DMs, connection requests, and inbound replies that reference a specific post. This is the cleanest attribution loop on LinkedIn.
- Meetings booked from content. The pipeline metric the rest of the funnel exists to feed.
What to deprioritize: the mean impressions figure, follower count (vanity unless paired with reach data), and like counts (the weakest engagement signal in the algorithm). For benchmarks on what "good" looks like across these pipeline metrics, the 2026 LinkedIn outreach benchmarks covers reply rate, acceptance rate, and meeting conversion on Reachium's published data.
FAQ
What is the average number of impressions on a LinkedIn post?
For a typical individual account, the median post earns a few hundred impressions while the mean lands in the thousands. The median is the more useful benchmark because LinkedIn impressions follow a right-skewed distribution, where a small number of viral posts pull the average upward and away from what a typical post actually earns.
Is 200 to 300 impressions per post normal?
Yes. That range sits right around the median for a typical account, which means a marketer posting in that range is at the middle of the distribution, not behind it. Below 200 repeatedly is worth investigating, but a single low-impression post is normal variance, not a problem.
Why are my impressions so much lower than the averages I see online?
Because most published "averages" are means, and means are inflated by viral outliers. The honest comparison is median against median, and by that yardstick a few-hundred-impression post is a match, not a miss.
How many impressions do I need to get leads from a post?
The number matters less than the format. A 600-impression lead-magnet post that earns 40 keyword-triggered comments can produce more identified leads than a 6,000-impression post with no capture mechanism. The capture mechanic determines lead volume more than raw reach does. The LinkedIn lead magnets explainer covers the comment-to-DM flow in detail.
Why do some of my posts get 10 times more impressions than others?
Usually format and length, in that order. Lead-magnet posts tend to draw many times the impressions of regular posts, and posts in the 600 to 1,200 character range dramatically out-reach posts over 2,000 characters. Topic and timing matter at the margin, but format and length explain most of the variance.
Want to put this into practice?
Reachium automates LinkedIn outreach, content publishing, and inbox management in one platform.
Start Free →Sources
- Linked Insider: 2026 LinkedIn outreach benchmarks
- Linked Insider: How LinkedIn lead magnets work
- Linked Insider: Ideal LinkedIn post length
- Reachium
- LinkedIn Marketing Solutions: How to build a strong LinkedIn page and grow your following
- LinkedIn Engineering Blog: Feed and ranking
- Pew Research Center: Social media fact sheet