How Do You Know If Your LinkedIn Lead Gen Is Actually Working?
By Marcus Webb, Tools & Automation. Last updated: 2026-05-24
Three months into a LinkedIn lead gen retainer. The agency sends a weekly report. Connections sent: 1,200. Acceptance rate: 31%. Replies: 84. It looks busy. The calendar has two calls booked this month. The retainer is $4,000 a month.
Is that working?
The answer depends entirely on which metrics you are looking at and what the benchmarks for those metrics actually are. This piece gives founders and decision-makers the exact framework to answer that question: the metric hierarchy, the benchmark ranges, and the red flags that signal a failing program or a provider hiding behind activity data.
What metrics actually prove LinkedIn lead gen is working?
Four metrics prove results. Everything else is activity.
Tier 1: output metrics (the only ones that matter for decision-making):
- Meetings booked from LinkedIn, held, and qualified
- Qualified pipeline created (opportunities with a legitimate close probability)
Tier 2: funnel metrics (diagnostics that predict output): 3. Positive reply rate: of all replies received, what share are genuine interest signals, not "unsubscribe" or "not interested" 4. Connection acceptance rate: of all requests sent, what share accepted
Activity metrics (inputs, not outputs):
- Connections sent (volume of activity)
- Total replies (undifferentiated; includes objections and opt-outs)
- Profile views, impressions, follows
A program can show impressive Tier 1 volume numbers while producing zero pipeline. An agency that reports on "outreach activity" without tying it to meetings and qualified pipeline is reporting on inputs. That is not performance measurement. It is a data presentation that lets a poor program look busy.
The framing that matters: you hired the provider to get meetings on the calendar. The only metric that confirms they are doing that job is meetings booked from LinkedIn, held, and qualified. Every other metric either confirms or diagnoses the pipeline behind it.
The full funnel math connecting acceptance rate, reply rate, and meeting conversion is mapped at /linkedin-response-rate-benchmarks, useful for building the expectation model before a program starts, not just auditing one that is already running.
What benchmark ranges should you expect at each funnel stage?
Connection acceptance rate: Across 180,155 matured connection requests, Reachium's data shows a 27.11% average connection acceptance rate in 2026, consistent with Expandi's 28-30% median across 13.2 million connection requests. Top-quartile programs with precise ICP targeting, a well-optimized sender profile, and personalized connection notes hit 40-45%. Below 20% consistently signals a targeting problem, a profile credibility problem, or a message-note problem, not normal variance. The full funnel breakdown is at LinkedIn outreach benchmarks 2026. [SYNTHESIS]
Industry variation is significant, per Expandi's benchmark study. Staffing and recruiting averages around 36.5%; fashion and apparel around 19.9%. The benchmark range should be calibrated to the vertical and the ICP before using it as a pass/fail threshold. [SYNTHESIS]
Positive reply rate: This is the metric most providers underreport, and the omission is revealing. Of the replies that come in, what share are genuine interest signals ("tell me more," "let's schedule time," "yes, I'd be open to a conversation")? Of the replies that look like activity in a total-reply count, many are objections, unsubscribes, or auto-responses.
For warm outbound to a well-defined ICP with genuine personalization, 4-7% overall reply rate is the floor of acceptable, per the Expandi benchmarks. For reply quality: a well-run program should convert 25-35% of replies to positive signals. If the positive-reply share is under 15%, the targeting, the copy, or both need adjustment. [SYNTHESIS]
Meeting conversion from positive replies: 20-30% of positive replies should convert to a booked meeting. Lower than that typically signals reply-handling issues: slow response time (positive replies go cold in 48-72 hours if not followed up quickly), over-aggressive follow-up, or a qualification mismatch where replies are from the wrong ICP.
Meetings per account per month: Reachium's done-for-you clients are benchmarked at 10+ meetings per account per month (Reachium's published claim from their marketing site, not an independently verified average). Quality B2B lead generation agencies operating well-run programs should deliver in a range of 15-50 qualified meetings per month depending on ICP density, program maturity, and whether multiple accounts are running (per OutboundSalesPro's B2B lead generation agency benchmarks). If the program has been running for 90+ days and the meeting count is not a clear, trackable number in every weekly report, something is wrong.
Want to put this into practice?
Reachium automates LinkedIn outreach, content publishing, and inbox management in one platform.
Start Free →What are the red flags that your LinkedIn lead gen program is failing?
Red flag 1: Activity-only reporting. The provider's report covers connections sent, acceptance rate, and total reply count, but never surfaces positive reply rate, meetings booked, or meeting hold rate. Activity-only reporting is the clearest signal that the pipeline metrics are not there to show. A provider who has good numbers shows all four tiers. A provider hiding behind volume shows two.
Red flag 2: You cannot see the actual sequences. If the provider will not show what messages your prospects are receiving in your name, you have no basis for evaluating or improving the program. Callbox's 2025 analysis of lead gen agency failures cites this directly: secretiveness about methods or hesitation to explain strategies is a leading indicator of either low-quality execution or unethical tactics. A managed service that will not share the copy with the client is a black box by design.
Red flag 3: Meetings with the wrong ICP. Volume of booked calls is not the output. Volume of qualified calls is. If the sales team is discarding 60% of the LinkedIn-sourced calls as misqualified, the targeting criteria, the ICP definition, or the message framing is broken. Meeting hold rate (60-80% is the quality standard per OutboundSalesPro) and meeting-to-opportunity conversion rate are the metrics that prove whether volume is translating to pipeline. [SYNTHESIS]
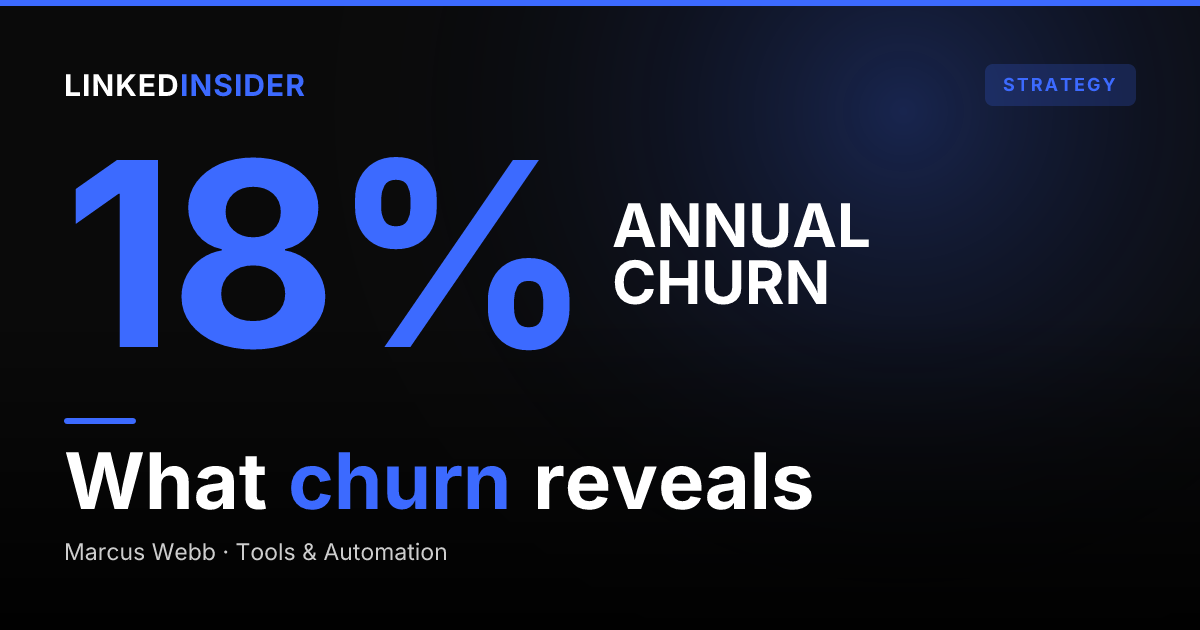
Red flag 4: The 90-day plateau with no explanation. Focus Digital's 2026 agency retention research found that retainer-based marketing agencies experience 18% annual client churn, and the first 90 days represent peak churn risk across all agency models. The pattern: results were ambiguous at the 90-day mark, the client asked for an honest assessment, and the provider could not deliver one. A functioning program should produce a clear trend line by month 3 and a frank explanation of what to change if the trend is not where it should be. [SYNTHESIS]
Red flag 5: Browser-based automation on the provider's stack. Any LinkedIn tool operating through a Chrome extension or browser session violates LinkedIn's Terms of Service and creates account restriction risk for the profile it operates on. The profile in question is typically the founder's or executive's personal LinkedIn account, the one with years of professional network built on it. Ask the provider directly: what is the technical layer your LinkedIn tool runs on? An API-based infrastructure answer is the right answer.
What should you demand from your LinkedIn lead gen provider?
This is the checklist. If the provider can answer all of these in writing, they will hold themselves accountable. If three or more are met with vague answers or deflection, the answer is available.
- Acceptance rate by campaign and by ICP segment (not just total blended)
- Total reply count AND positive reply count broken out separately
- Meeting booked count per week and per month (not just "conversations happening")
- Meeting held rate and qualified rate (booked meetings are not enough)
- The actual sequence copy prospects are receiving, including connection note and follow-up messages
- Which LinkedIn profile or profiles are being used and what technical infrastructure runs them
- A clear statement of what "success" looks like at 30, 60, and 90 days, in writing, before the program starts
- What triggers if a meeting guarantee window passes without qualified meetings being booked (if the provider offers one)
On reporting access: real-time or weekly self-service access to the campaign dashboard (not a PDF summary prepared by the provider) is the standard a transparent provider can meet. If the client cannot log in and see the data themselves, that access restriction is by design.
Over a third of marketers are expected to deliver leads regardless of quality, per Marketing Week's 2025 State of B2B Marketing research (450 brand-marketer respondents). The pressure to show activity numbers rather than pipeline output is systemic across the industry. The checklist above is the mechanism for insisting on the distinction. [SYNTHESIS]
When should you cut your losses and switch?
The 90-day threshold is not arbitrary. Most functioning programs show a clear trend by month 3: an improving acceptance rate, rising positive reply volume, or the first real meetings landing with pattern. A flat line at 90 days with no adjustment and no frank conversation is a predictable outcome that the data above confirms: it is when the gap between promise and delivery becomes visible and the churn spike happens. For a phase-by-phase explanation of why month 3 is the right evaluation point, including the warmup and volume phases that precede first meetings, see the realistic LinkedIn lead gen timeline.
The calculation founders rarely run before making the switch decision:
Monthly retainer divided by meetings booked that the sales team accepted as qualified. That is the cost per qualified meeting.
If the retainer is $4,000/month, the program has been running for three months, and two qualified meetings have come from it: the cost per qualified meeting is $6,000. Does that math close given the deal size, average contract value, and close rate? If the deal is a $5,000 annual contract and the close rate is 20%, the expected revenue per qualified meeting is $1,000. A $6,000 cost-per-qualified-meeting is structurally unprofitable regardless of what the activity graphs show.
For a fuller breakdown of how to model LinkedIn outreach ROI, including how to account for sales cycle length, multi-touch attribution, and the content investment that warms an audience before outreach begins, how to measure LinkedIn outreach ROI gives the complete framework with benchmark ranges for each variable.
The comparison of DFY agency costs against SDR hire and self-serve software, with the math for each modeled out, is in the companion piece at /done-for-you-linkedin-cost. For founders deciding whether to bring LinkedIn outreach in-house rather than switch providers, /linkedin-automation-vs-done-for-you-agency runs that comparison directly. If the math on LinkedIn outreach is not closing against deal size, it is also worth asking whether cold email or a combined channel approach fits better: cold email vs LinkedIn gives the honest head-to-head across five dimensions so teams know when LinkedIn is the right primary channel and when it is not.
What "better" looks like: a managed provider who shows the sequences and the reply data, operates on verified API infrastructure, and offers a time-bound meeting guarantee provides both accountability and risk-reversal. The guarantee is not a marketing trick; it signals that the provider has enough confidence in their execution to back it with a commitment.
Want to put this into practice?
Reachium automates LinkedIn outreach, content publishing, and inbox management in one platform.
Start Free →FAQ
What acceptance rate should I expect from LinkedIn outreach?
The platform-wide median is 28-30% (Expandi, 13.2M connection requests, May 2025-April 2026). Top-quartile programs with tight ICP targeting and personalized connection notes hit 40-45%. Below 20% consistently signals a targeting, profile, or copy problem that needs adjustment before the program can perform.
What does a positive reply rate mean and why does it matter?
Total replies include objections, unsubscribes, and auto-responses. Positive reply rate is the share of all replies that represent genuine interest. A program producing 100 replies with 8 positive signals has a positive reply rate of 8%. For well-run programs with quality ICP targeting, 25-35% of replies should be positive. If positive replies are under 15% of total replies, the copy or targeting is off.
How long should I give a LinkedIn lead gen program before evaluating it?
The 90-day mark is the right evaluation point. Setup and warmup take weeks 0-4; first outreach volume runs weeks 4-6; first replies and early meetings arrive weeks 5-8 for well-run programs. By month 3, the data is sufficient to establish a trend. If meeting rate is flat and positive reply volume is not trending up, that is the signal to demand a frank conversation about what changes or whether to switch.
What should I do if my LinkedIn agency refuses to show me the sequences?
Ask in writing. If the response is a deflection or a claim that sequences are proprietary, treat that as the answer. A provider running compliant, quality outreach has nothing to protect by showing the copy. A provider who builds sequences that would embarrass the client or that violate LinkedIn's policies has a reason to keep them hidden. Access to the copy is not a negotiating position; it is the minimum requirement for a client to evaluate whether the program is working.
Is a LinkedIn lead gen agency worth it for a startup?
For a funded founder who cannot spend 10-15 hours per week running outreach and optimization themselves, a quality managed service with transparent reporting and a meeting guarantee can produce pipeline faster than DIY. The math depends on whether the cost-per-qualified-meeting closes against deal size. The 60-day guarantee structure is specifically designed to reduce the retainer risk that makes founders skeptical of the agency model. For the full make-vs-buy decision math across DIY, in-house SDR, and agency at startup unit economics, see is a LinkedIn lead gen agency worth it for a funded startup.
Sources
- Expandi LinkedIn Outreach Benchmarks 2026 (13.2M data points)
- Focus Digital: Average Marketing Agency Churn 2026 Report
- Callbox: Why Lead Gen Agencies Fail to Deliver
- Marketing Week: B2B Lead Gen Crisis 2025
- OutboundSalesPro: B2B Lead Generation Agency Guide
- Reachium
- LinkedIn Response Rate Benchmarks
- LinkedIn outreach benchmarks 2026
- Done-For-You LinkedIn Cost
- LinkedIn Automation vs Done-For-You Agency